Download

1 / 8
80 likes | 109 Views
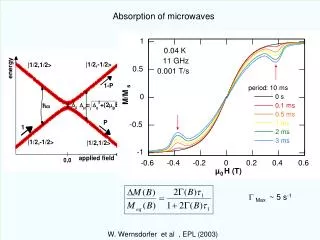
Absorption Spectrum of HCl. Data courtesy of Tonya Rice from Physical Chemistry course. Another data selection exercise. In this exercise we will plot absorption spectrum data for HCl. We will select out the region of interest.

E N D
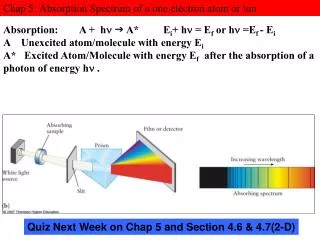
Absorption Spectrum of HCl Data courtesy of Tonya Rice from Physical Chemistry course
Another data selection exercise • In this exercise we will plot absorption spectrum data for HCl. • We will select out the region of interest. • We will then identify the points of maximal absorption and plot them.
Plot the data in HCL.xls. We will next re-plot the region showing the most absorption.
Use the Scatter with Smooth Lines option to plot the data from the selected region.
Collect the energies for the absorption “peaks” on the right and associate them with the numbers 0,1,2, …. The first data point is (0, 2905.861). Place the mouse over the peak. We are interested in the energy which is the first number of the pair
Collect the energies for the absorption “peaks” on the left and associate them with the numbers 1,2, 3…. The first data point is (1, 2864.879)