Download
1 / 14
140 likes | 286 Views
26th Annual Management Information Systems [MIS] Conference. John Kraman , Oklahoma SDE Nancy J. Smith, DataSmith Solutions Thursday, 2/14/2013. Oklahoma Data Pipeline Project Needs Assessment Survey: Process and Findings. Oklahoma Landscape. 670,000 overall enrollment 537 districts

E N D
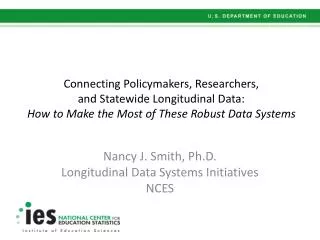
26th Annual Management Information Systems [MIS] Conference John Kraman, Oklahoma SDENancy J. Smith, DataSmith SolutionsThursday, 2/14/2013 Oklahoma Data Pipeline Project Needs Assessment Survey: Process and Findings
Oklahoma Landscape • 670,000 overall enrollment • 537 districts • Range between 40 and 40,000+ in enrollment • State law forced switch in 2011 to a centralized IT • OMES versus SDE • WAVE, EWIS, EDFacts, upcoming projects 2
Needs Assessment Survey • Electronic survey of all districts • Disseminated by SDE and CCOSA • Open September – December 2012 • Six Sections: • Technology • Data standards and documentation • Data-related training • Data governance • Communication • Financial – staff, resources, costs 3
Follow-up Engagement • Voluntary participation via • Follow-up phone calls • Follow-up emails • In-person focus groups • Two focus groups in late November • Included superintendents and technology staff • In-person in Oklahoma City, not at SEA 4
Participation in Survey • Responses from 259 of 537 districts (48.2%) • 184 provided district name • 173 distinct districts (multiple responses from 11 districts) • 108 superintendents (out of 175 who provided role or title) • District Size of 173 districts: • 0-500 = 72 respondents • 501-1,000 = 44 • 1,001-5,000 = 44 • 5,001-10,000 = 7 • >10,000 = 6 5
Technology • Trouble uploading or submitting files: • WAVE: 62%sometimes or frequently (122) • EDFacts: 44%sometimes or frequently (108) • Problems center on • Confusing error messages (65%, n=122) • Delays with submission (51%, n=95) • Data or file correction process (65% n=155) • Areas that rarely or never cause problems • data element formatting (19%, n=36) • file size limits (15%, n=29) • interoperability standards and processes (12%, n=23) 6
Data Standards and Documentation Clarity of documentation about • File submission: 38% good or excellent (77) • File formatting: 36% good or excellent (73) • File due dates: 36% good or excellent (83) Usefulness of documentation about • File submission: 53% useful or very useful (107) • File formatting: 52% useful or very useful (104) • File due dates: 53% useful or very useful (107) Ease of access to documentation about • File submission: 34% easy or very easy (68) • File formatting: 34% easy or very easy (67) • File due dates: 33% easy or very easy (67) 7
Data Governance • 95% of respondents indicated that they don’t participate in SDE data governance or advisory committees (190) • 76% are unaware of SDE data governance activities (151) • 63% indicated their districts have designated data stewards responsible for specific elements (124) • 43% indicated that their districts have a designated data coordinator (83) 9
Communication re: Data Requirements • 56% find current communication informative (107) • 52%: helpful (99) • 51%: disseminated to right people (95) • 43%: clear (82) • 41%: frequent enough (78) • 37%: detailed enough (71) • 34%: timely (66) 10
Financial and Resources Biggest concerns • Enough staff to manage collections 82% (154) • Time & resources for file creation, 68% (124) validation & submission • Data quality 62%(115) • Sustaining resources for district SIS 61% (112) 11
Financial and Resources “What services or resources do you wish SDE could provide to reduce your costs?” • 44%: Improved access to SDE data and reports (n=83) • 38%: A statewide SIS (n=71) • 35%: Improved interface or portal for use with file uploads (n=65) 12
Synopsis • Better management of existing processes and documentation • Better communication, specifically about changes to data requirements, new tools, and upcoming plans • Fewer last minute changes to collections • Do a few things well rather than trying to do lots of big changes at once • More transparency about processes and governance • More engagement from field to ensure process and communication management meets LEA needs and understanding • Partnership and clear definition of roles and responsibilities between SDE, OMES and LEAs 13
SDE Response and Plans • Data Governance Committees • Update roles and responsibilities between SDE and OMES • More internal capacity around data at SDE • ??? 14