
* C ORRESPONDING AUTHOR
This study explores the quantification of calcitonin using high-resolution accurate mass spectrometry (HRAMS), specifically through the targeted selected ion monitoring (tSIM) mode on a Q-Exactive Orbitrap. The method successfully achieves a lower limit of quantification (LLOQ) of 5.0 pg/mL, demonstrating good sensitivity, selectivity, and assay precision. The influence of charge states and extraction windows on assay performance was assessed. Results showed optimal detection and quantification capabilities, providing a valuable approach for calcitonin analysis in bioanalytical applications.

* C ORRESPONDING AUTHOR
E N D
Presentation Transcript
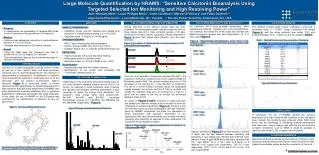
Large Molecule Quantification by HRAMS: “Sensitive Calcitonin Bioanalysis Using Targeted Selected Ion Monitoring and High Resolving Power” Jean-Nicholas Mess1, Louis-Philippe Morin1, Gene Ciccimaro2, Maroun El Khoury2 and Fabio Garofolo1* 1 Algorithme Pharma Inc., Laval (Montréal), QC, Canada, 2 Thermo Fisher Scientific, Sommerset, NJ, USA OVERVIEW METHODS CALCITONIN CHARGE STATE OPTIMIZATION CALCITONIN SENSITIVITY AND SELECTIVITY CALCITONIN RESULTS For Calcitonin, the 5 most abundant isotopomers were selected and summed . However prior to final quantification, the sensitivity and selectivity of the assay was verified with different extraction window over each isopotomers: 10, 5, 3 and 1 ppm (Figure 5). Overall sensitivity of the different charge state was then evaluated. Chromatographic peaks was generated for each of three charge state with a mass extraction window of 20 ppm centered on the most intense isopotomer. Results illustrated in Figure 3 show that charge state [M+4H]4+ was the most abundant. The method showed good results: calibration curve had a correlation factor r2 = 0.9917, using a quadratic 1/x2 weight (Figure 6) and the assay precision was below 7.3% with accuracy between 97.2 – 108.5% for the QC samples (Table 1). • SAMPLE PREPARATION • Calibration curves and QC samples were spiked post-extraction in crashed plasma diluted in 0.1% HCOOH. • Calcitonin range: 5.0 pg/mL to 10 000 pg/mL. • CHROMATOGRAPHY • HPLC: Open Accela pump and autosampler. • Column: Zorbax 300SB-C18, 50x2.1mm, 3.5µm. • Gradient: Elution of 0.1% HCOOHand ACN at 500µL/min • DETECTION • Thermo Scientific Q Exactive Benchtop Orbitrap. • Electrospray positive ionization mode. • Resolution power of 140,000 (FWHM at m/z = 200). • Quantification • Samples were acquired via Xcalibur software. • Quantification of the results was completed with TraceFinder software version 2.1. • Purpose • To demonstrate the applicability of targeted SIM mode of the Q-Exactive for the quantification of Calcitonin. • Method • Calcitonin was spiked post-extraction in crashed plasma diluted 1:4 in 0.1% HCOOH. • Samples were injected on a Q-Exactive orbitrap. • Result • Using the tSIM mode, the instrument was able to achieve an LLOQ of 5.0 pg/mL for Calcitonin. • The high resolution given by the instrument was able to remove interferences. Table 1 : Method Precision and Accuracy table of Calcitonin Figure 5 : Representative chromatograms of the effect of the extraction window on the selectivity and sensitivity at the LLOQ level ( 5pg/mL). Figure 3: Sensitivity of Calcitonin with extraction windows of 20 ppm at different charge states. [M+3H]3+ MEW: 1 ppm % C.V.: 14.5% [M+4H]4+ INTRODUCTION [M+5H]5+ Calcitonin is a linear polypeptide hormone found in human as well as in fish, reptiles, birds and other mammals. Calcitonin can be used therapeutically for the treatment of hypercalcemia or osteoporosis. Quantification of calcitonin for pharmacokinetic purpose is challenging due to its fast elimination and low plasma concentration. Salmon calcitonin (Figure 1) is structurally similar to human calcitonin but with greater potency. Recent developments in high resolution accurate mass spectrometry (HRAMS) have given bioanalytical scientists additional tools to overcome quantification challenges associated with large molecules. In this study, the use of HRAMS on the Q-Exactive was evaluated for the quantification of calcitonin at very low pg/mL level. MEW: 3 ppm % C.V.: 10.3 % Once the most abundant charge was selected ([M+4H]4+), the acquisition method for Calcitonin was set in targeted Single Ion Monitoring mode (tSIM). The isolation window was set at 10 Da (centered on the average m/z of the [M+4H]4+ of Calcitonin). The use of a narrow isolation windows allows the quadrupole located between the source and the C-Trap to exclude ions outside the targeted range prior to entering the C-Trap as a result that the signal of the ions of interest are enhanced, leading to lower LLOQ. CALCITONIN OPTIMIZATION Optimization of the instrument was performed by injection of a neat Calcitonin standard solution into the HESI II ion source. As opposed to small molecules, large molecule are typically multi-charged, therefore optimization is also necessary to define the charge state distribution. For Calcitonin, three charge states were predominant: [M+3H]3+, [M+4H]4+ and [M+5H]5+ (calculated monoisotopic masses m/z 1144.2450, m/z 858.4356 and m/z 686.9499, respectively). (Figure 2). Figure 6: Calibration Curve of Calcitonin MEW: 5 ppm % C.V.: 14.5% As shown in Figures 2 and 3, ionization of large molecules are spread over different charge states and each of them are composed of multiple isopotomers (Figure 4). Contrary to the unit resolution given by triple quadrupoles, the high resolution given by HRAMS instruments can allow the summation of these isopotomers with precision. Summation of the isopotomers with very narrow windows can increase the assay selectivity and sensitivity as opposed to triple quadrupole that include the whole isotopic envelope. Figure 1: Structure of Salmon Calcinonin Figure 2: Charge states distribution of Calcitonin CONCLUSION MEW: 10 ppm % C.V.: 21.3% In conclusion, the use of HRAMS allowed the sensitive bioanalysis of a large molecule like calcitonin at the low pg/mL level. Indeed, this sensitivity was achieved under tSIM mode which has the advantage of shortening method development time. Moreover, using a cleaner and selective pre-concentration extraction procedure, such as MSIA, it would be possible to reach an even lower LLOQ to support clinical studies. [M+5H]5+ Figure 4: Representative isopotomers distribution of Calcitonin for charge state [M+4H]4+. [M+4H]4+ Results illustrated in Figure 5 show that extraction window of 3ppm was the best balance between selectivity and sensitivity. It was slightly less affected with chemical noise than the 5 and 10 ppm MEW and it was more sensitive than the 1 ppm MEW. %C.V. of the LLOQ at 5 pg/mL on 5 replicate (n=5) support this observation. The %C.V was respectively 14.5%, 10.3%, 15.5% and 21.3% for the 1,3,5 and 10 ppm MEW. 6 8 7.3 5 [M+3H]3+ ACKNOWLEDGEMENTS Algorithme Pharma would like to thank Maroun el Khoury, Gene Ciccimaro and Pat Bennet from Thermo Fisher Scientific for their support and valuable advice during the completion of this work. Cys-Ser-Asn-Leu-Ser-Thr-Cys-Val-Leu-Gly-Lys-Leu-Ser-Gln-Glu-Leu-His-Lys-Leu-Gln-Thr-Tyr-Pro-Arg-Thr-Asn-Thr-Gly-Ser-Gly-Thr-Pro * CORRESPONDING AUTHOR