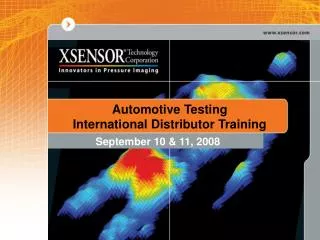
Automotive Testing International Distributor Training
560 likes | 727 Views
Automotive Testing International Distributor Training. September 10 & 11, 2008. Agenda - Wednesday Sept. 10, 2008. 8:00-8:45am Introductions & XSENSOR Tour 8:45-9:30am XSENSOR Order Process 9:30-10:30am Customer Service & RMA Process Customer/Distributor Login 10:45-12:30pm

Automotive Testing International Distributor Training
E N D
Presentation Transcript
Automotive TestingInternational Distributor Training September 10 & 11, 2008
Agenda - Wednesday Sept. 10, 2008 8:00-8:45am Introductions & XSENSOR Tour 8:45-9:30am XSENSOR Order Process 9:30-10:30am Customer Service & RMA Process Customer/Distributor Login 10:45-12:30pm X3 PRO Software v6.0 12:45-2:00pm Lunch 2:00-4:00pm X3 Sensors 4:00-5:00pm X3 PRO Electronics 5:00-6:00 Wireless Demonstration
Agenda - Thurs. Sept. 11, 2008 8:30-9:30 Sales and Product Review 9:30-12:00 Distributor Lead Presentations 4 Specific cases to be presented 12:00-13:00 Lunch 13:00-15:00 Distributors to Present/Discuss Sales Efforts What is working in your regions How do position against competition 15:00-17:00 Next Steps Sales assistance/Marketing support/Sales support Process improvements Product Development ideas
Manufacturing Process September 10
Manufacturing Operations • Production Processes: • Customer Order Management • Production Planning / Pull • Manufacturing Process • Quality Control • Calibration
Customer Order Process Receive Orders: Email - forwarded on to Order Management Faxes to (403) 205-4013 – go directly to order management Verify Orders – 2 business days Order Management reviews the order for completeness & contacts customer if necessary to get any questions answered. Order Management passes on the order with notes and lead time information to Accounting
Lead Time Lead times range depend on the number of orders in the queue and the production capacity at the time Typical lead times range from 5 days to 4 weeks (as low as 1 day for POS because of finished goods inventory) Production Planning / Pull
Process Orders – 1 business day Accounting reviews the order for pricing, completeness of information, payment terms and inputs the order into the accounting system Accounting generates the order confirmation which is sent to the customer For pre-payment items Accounting creates a Proforma invoice which also serves as the sales confirmation. In these cases once payment is received the order can proceed. Accounting gives the purchase order and order confirmation to Order Management who schedules it and files the documentation into the Sales Order binder. Customer Order Process
Product Verification & Shipping Verification Mates electronics with pads based on order Performs CSA / Medical Standards tests and system test Verifies documentation (ensures all information is available for shipping & all material is packaged together) Shipping Reviews order and pulls accessories and packaging materials according to pull card. Accounting sends Invoices & Packing slips to the customer
Quality Control MMTS: Manufacturing Metrics Tracking System Defect tracking by serial number Defects logged into database Quality Check Points Lamination – shorts testing & material prep quality throughout process Test – electrical test of sensor with pressure cycling Assembly – Workmanship Calibration – Functional & Workmanship System test – Functional - electronics & documentation included
Calibration Hysteresis Calibration: Specifications: Standard pressure ranges 5-50mmHg, 5-100mmHg and 10-200mmHg Accuracy tested to are +/- 10% FS or +/- 10mmHg Equipment: Dual air bladder calibration chamber with sensor stretched over bladder Internal XSENSOR software versions and IP Regulators referencing NIST traceable gauges IP Regulators are calibrated internally against the NIST gauge every month (was annual) NIST Gauges replaced or recalibrated annually and are rated to +/-2.5mmHg (4-1 makes our calibrations within +/- 10mmHg).
Hysteresis Calibration: (continued) Verification Protocol: Verifies that over 99% of cells fall within +/-10% FS or 10mmHg of a set pressure Calibration certificate automatically generated Calibration procedure (handout) available on request Calibration
Calibration Linear Calibration: Process: Uses 5-9 steps of data and linear interpolation between data points Specifications: Accuracy is tested to be within +/- 10% FS average over all sensor elements Dual air bladder calibration chamber with sensor stretched over bladder up to 20psi (NIST Gauge accurate to +/-.3psi which makes our calibrations within +/-1.2psi) Single bladder air up to 100psi (NIST Gauge accurate to +/-2 psi which makes our calibrations within +/- 8psi). Single bladder hydraulic oil up to 200psi (NIST Gauge accurate to +/- 5psi which makes our calibrations within +/-20psi)
Linear Calibration: (continued) Verification protocol Verifies that average pressure across all sensing elements fall within +/-10% full scale for all pressure steps NIST Gauges replaced or recalibrated annually Calibration certificate to be automatically generated Calibration procedure available upon request Calibration
Calibration Sample Certificate of Calibration
Customer Service Login September 10
Customer Service Objective To provide outstanding customer service Accessible (phone & email) Knowledgeable Expectations are met for turnaround of returned product Priorities are managed – consistently deliver expected lead times and reduce lead times in special cases Key customers Urgent needs Team approach – customer service is first point of contact but has access to XSENSOR team.
Customer Service Current Process Outline Response Procedure Expectations 80% of calls met with live answer. Emails and voicemails returned within 24 hours. Reasonable (and firm) return times. Contact Distributor is contacted by customer and performs “first level” service assessment to determine the needs of the user. XSENSOR Customer Support is informed of the issue and provided with the details. Problem resolution/RMA number is provided or direct contact with the customer is initiated.
Customer Service Current Process Outline (continued) Customer Service Request (CSR) 3 Categories: Resolved Immediately (single call, email), CSR closed at end of call/after email sent. Resolved without return of customer system. May require investigation and call back, CSR closed when customer has been provided with a resolution to reported problem. Resolved after return and repair/recalibration of the XSENSOR system. CSR closed upon shipping the system back to customer.
Customer Service Current Process Outline (continued) Customer Service Request (CSR) Troubleshooting and Repair Equipment is evaluated, to replicate defect. Difficult if no fault found Work order created to repair if deemed possible. Repairs are made by production team. Successfully repaired parts are tested and returned to customer*
Customer Service Challenges Inconsistency Varying Return Times FIFO queue leaves equipment that could be moved quickly waiting on others that take more time (i.e. pad/electronics repairs take much longer than calibration) Shipping and repair queue length. Priority conflicts. Equipment returned without RMA. Communication Shipping and repair queue length leaves nothing to report. Evaluating each return requires work and causes CS to be inaccessible at times. Confusion between customer and CS (i.e. Materasso)
Customer Service Future Plans Communication Firm Commitment to Expectations CSR’s get response within 24 hours. Every customer updated within 48 hours of the arrival of equipment at XSENSOR. (Immediate) Set minimum contact expectations – RMA status report. (Early October ‘08) Customers are to be notified if return times are going to exceed expectations. (Early October ‘08)
Customer Service Future Plans (continued) RMA Process Expected Return Times (~Mid-October ‘08) Calibration = 1 Week return (from arrival time) Repair = ~2 Week return (from arrival time) Replacement = ~4 Week Return (from arrival time, but can vary based on production schedule) Suggestions Web-based dialog between XSENSOR CS and distributors WebEx based support
Customer Login http://www.xsensor.com/customer Software Updates Logging In Profile Information Video Training Email Support User Manuals *Refer to the Customer Login document for detailed information regarding logging into the site and specifics about these 5 sections of the webpage.*
Distributor Login Brand Guidelines Resources Logging In Marketing Materials Product Images *Refer to the Distributor Login document for detailed information regarding logging into the site and specifics about these 4 sections of the webpage.*
PRO v6.0 Software September 10
PRO v6.0 - Architecture Up to 100% Speed Increase • IX500:256.256.22 increased from < 3Hz to 5.54Hz • PX100:48.48.02 increased from 32Hz to 46Hz Data streamed directly to disk • Increased data integrity (in the event of a sudden system crash, power loss, etc.) • Lessened memory requirements of the software Large files are saved and loaded quickly • Files that used to take minutes to load now take mere seconds
PRO v6.0 – New Features PRO v6.0 – New Features • Filmstrip Preview • Improved 2D Zoom/Numerical Mode • Copy & paste from image to spreadsheet • Export sensor groups in their original shape • Export to HTML • Measure line segments and area • Wiper sensor comparison tools
Software Quality Focus on software quality: Structured QA process Rigorous software testing Resulted in: Reduced critical fixes 0 critical bugs in field reported since PRO v6.0 launch Updates at planned intervals (e.g. twice yearly) All bugs should be filtered through Customer Service for insertion into the next scheduled test and release cycle.
PRO v6.1 – What’s Coming? • Frame Attributes • Pressure Gradient Fix • Print Sensor Groups • Frame Progress Navigation Slider
X3 Sensors - AT September 10
New X3 Sensors New Sensor Testing Protocol Hysteresis Creep Repeatability Frequency Response Reliability LX100 Seat Sensors – Low Pressure, High Accuracy LX200 Seat Sensors – Medium Pressure, High Accuracy IX500 Tire Sensors – Lower Resolution, Larger Size PX100 Wiper Sensors Lower Resolution, High Repeatability, Fast Sampling Speed Higher Resolution, High Repeatability, Slower Sampling Speed
Common Performance Questions Typical questions regarding the performance of a pressure imaging system: How much hysteresis is present? How much creep is present? How repeatable are the measurements? How fast is it? How robust is the sensor pad mechanically? New sensor testing protocol has been implemented to address these questions. How accurate is it?
Hysteresis What is it? The phenomenon exhibited by an imperfectly elastic material in which the reaction of the system to changes is dependent upon its past reactions to change. What does it mean? The sensor output at a given pressure will be different depending on whether the load is increasing or decreasing How do we characterize it? The sensor is loaded and unloaded to generate a “hysteresis loop” from which the amount of hysteresis can be determined.
Creep What is it? The gradual, deformation of a body produced by a continued application of heat or stress. What does it mean? When a constant pressure is applied to the sensor, the pressure output of the sensor will gradually increase over time. A sensor with a large amount of creep would not be suitable for long-term monitoring of pressure, for example, a person sitting in a chair for a long period of time. How do we characterize it? The sensor is loaded at several constant pressures and the pressure output of the sensor is recorded and compared to a reference set point.
Repeatability What is it? Repeatability is the variability of the measurements obtained by a user while measuring the same item repeatedly under the same conditions. This is also referred to as the inherent precision of the measurement equipment. What does it mean? How similar will multiple measurements of the same object be? How do we characterize it? A regular loading pattern is applied to the sensor. Statistical data is collected on this data and is analyzed to determine the mean pressure, standard deviation, etc. Low Precision Low Accuracy High Precision Low Accuracy High Precision High Accuracy
Frequency Response What is it? If the sensor dielectric is modeled as a damped simple harmonic oscillator (SHO), the frequency response is a measure of how the amplitude of the SHO changes with respect to the driving force at various frequencies. What does it mean? For dynamic measurements, the frequency response will tell the user how quickly the dielectric will respond to a rapidly changing load. If the applied load oscillates too quickly, the dielectric cannot response fast enough to yield accurate data. How do we characterize it? Starting from a low frequency (0.2 Hz, quasi-static), apply a sinusoidal pressure and record the sensor output and increase frequency. 70-30 amplitude: 3dB point (amplitude drops to 1/√2 of initial). 50-50 amplitude: ½ power point (amplitude drops to ½ of initial).
Reliability What is it? “…the ability of a system or component to perform its required functions under stated conditions for a specified period of time.” – IEEE definition What does it mean? Will the sensor perform reproducibly over time and how does handling, storing, general sensor use, etc. contribute to the overall operation of the sensor? How do we characterize it? Cornell test (ASTM F 1566-99 Section 9) with intermittent sensor verification – 100,000 cycles (equivalent to 10 years of use) Squirm test (following ASTM F 1566-99 Section 6) 125 lbs butt-form dropped on sensor and twisted to simulate someone sitting and twisting on the sensor – 125,000 cycles (equivalent to ~10 years of use)
Reliability Cornell Test 5-230 lbs cycling Squirm Test 125 lbs dropped & rotated
LX100 Sensor Performance Pressure Range 10-200 mmHg (Linear Calibration) Frequency Response 3dB Point: > 50 Hz (30% of initial amplitude) Half-Power Point: > 50 Hz (50% of initial amplitude) Creep Error < 3% FS drift from set point after 1 hour at 100 mmHg < 5% FS drift from set point after 1 hour at 200 mmHg Hysteresis Error < 4% FS Repeatability σ < 2.5 mmHg over 400 loading cycles µ < ± 3 % FS error (increasing pressure only)
LX200 Sensor Performance Pressure Range 0.1-15 psi (Linear Calibration) Frequency Response 3dB Point: ~ 22 Hz (30% of initial amplitude) Half-Power Point: > 30 Hz (50% of initial amplitude) Creep Error < 3% FS drift from set point after 1 hour at 7.5 psi < 4.5% FS drift from set point after 1 hour at 15 psi Hysteresis Error < 7% FS Repeatability σ< 0.1 psi over 100 loading cycles µ < ±3 % FS error (increasing pressure only)
Comparison Summary All calibrations are linear interpolation – no hysteresis compensation. σ:Standard Deviation – a measure of the spread of multiple measurements – the smaller this number is the tighter the distribution is µ: Mean (Average) value over several hundred measurements.
LX200 Sensors and Low Pressure Measurements LX200 is not intended to be a PX100 or LX100 replacement. While it can be used from 0.1 psi (5 mmHg), its design was not optimized for low pressure use. Example PX100 200 mmHg FS, ±10% FS Error (± 20 mmHg) Measurement: 100 ± 20 mmHg. Relative error: 20/100 = 20% LX200 775 mmHg FS, ±10% FS Error (± 77.5 mmHg) Measurement: 100 ± 77.5 mmHg. Relative error: 77.5/100 = 77.5% You wouldn’t use this 100 psi gauge if you were only measuring pressures less than 10 psi. Similarly, the LX200 is not intended for routine measurements at low pressures.
IX500 Tire Sensors What it is used for: Tire-tread analysis Performance testing Dynamic testing Why it works: Durable, flexible and conformable to uneven surfaces Provides a higher data acquisition rate than previous tire sensors Maintains high image resolution How it is used: Short testing cycles (approx. 3 minutes) Rest between testing cycles should be approx. 20 minutes
PX100 Wiper Sensors What it is used for: Measuring low pressures and linear forces under a line load Aiding designers and engineers in selecting material composition and wiper blade profile Determining whether the wiper blade meets product design specifications Why it works: Maintains calibration under a high number of cycles Provides repeatable results and low cell-to-cell variability Responsive at low pressures Thin and extremely conformable How it is used: Short testing cycles (approx. 3 minutes) Rest between testing cycles should be approx. 10 minutes