Corn Outlook Conference 2008: Trends, Challenges, and Projections
290 likes | 312 Views
Explore the latest insights on corn production, supply, utilization, and market dynamics presented at the Corn Outlook Conference 2008 in Kansas City. Gain valuable perspectives on acreage competition, input costs, energy market linkages, and future agriculture trends.

Corn Outlook Conference 2008: Trends, Challenges, and Projections
E N D
Presentation Transcript
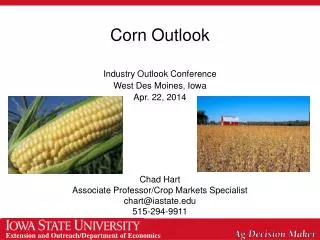
Corn Outlook Midwest, Great Plains, and Western Outlook Conference Kansas City, Missouri August 19, 2008 Chad Hart chart@iastate.edu 515-294-9911
Nearby Corn Futures Source: CBOT nearby futures
Corn Supply and Use -0.3 +0.4 +6.6 +573 +3 +100 +50 +150 -25 -22 +300 $6.00 -0.60 $5.40 -0.10 Source: USDA
Crop Acreage Ratio of Harvested to Planted Acres These 4 states are harvesting 877,000 acres less than usual. Given projected yields, that’s 147 million bushels.
Crop Progress Source: USDA-NASS, August 12, 2008
Continuing Weather Concerns Source: The Weather Channel
Harvest Time Outlook Source: National Weather Service, Climate Prediction Center
Crude Oil Prices Source: U.S. Dept. of Energy, Energy Information Administration
Price Ratios (Jan. 2, 2008 = 1) Sources: CBOT and NYMEX nearby futures
Population Source: U.S. Bureau of the Census, International Data Base
Real GDP Sources: International Financial Statistics, Global Insight
Per Capita Meat Consumption Source: FAPRI
Exchange Rate Ratios (Jan. 2007 = 1) Source: USDA-ERS
Exchange Rate Ratios (Jan. 2007 = 1) Source: CME futures
World Corn Production Source: USDA, WASDE Report, August 12, 2008
Corn & Soybean Area Source: USDA-NASS
Corn & Soybean Area Growth rate of 1.5 million acres per year
CRP Expiring Contracts Source: USDA-FSA
Land Availability Data from 1997 and 2002 Census of Agriculture 1997 2002 Land in farms 955 938 Total cropland 445 434 Harvested cropland 319 303 Cropland in pasture 66 61 Other cropland 60 71 Total woodland 77 76 Pastureland (not crop) 398 395 Land in other uses 34 33 2007 931 304 Source: USDA-NASS
Input Costs Source: USDA, Agricultural Prices, July 31, 2008
Acreage Competition for 2009 • More land will shift to corn and soybeans • High prices for both crops • Tight stock situations • Demand remaining fairly strong • Futures price ratio favors corn (8/15/08) • Dec. 2009 Corn = $5.925 per bushel • Nov. 2009 Soy = $12.19 per bushel • Current ratio = 2.06 • Historical average ratio ~ 2.3
Thoughts for 2008 • Looking for a later than average frost • Wet spring/flooding impacts will likely show up in yields • Demands will adjust with prices • Slack capacity in ethanol • Feed wheat vs. coarse grains • How about the dollar? • Weaker dollar has helped hold up exports • Most important ag. statistic: Crude oil price? • Higher prices provide room for ethanol • But also lead to higher input costs
Thoughts for 2009 and Beyond • Many of the storylines from the past few years will continue • The race of supply vs. demand • The competition for acreage • Ethanol’s buildout • Livestock’s adjustment • Energy price & general economy concerns • Market volatility will remain high • Tight stocks • Link to the energy markets • More market players with different trading objectives
Thoughts for 2009 and Beyond • Farming is a competitive industry • Input costs are racing to catch up • Fertilizer and fuel prices leading the way • Land prices/rents have had a strong run • “What’s your break-even price?” • The potential and the pitfalls of cellulosic biofuels • One crop, many demands Reportedly ancient agricultural curse: May you live (and market) in interesting times.