1 / 54

Corn Outlook

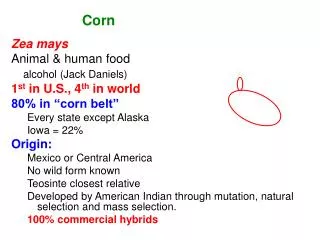
Corn Outlook. U.S. & Foreign Coarse Grain Production. U.S. share of world production: 90-91: 28.1% 08-09: 29.6%. Coarse Grain Production (mmt). U.S. Corn Acres Planted, 1970-08. 2008 was 2 nd largest since 1949. U.S. Corn Acres Planted, 1926-08. Million Acres Planted by Crop.

gerda
Download Presentation

Corn Outlook

An Image/Link below is provided (as is) to download presentation Download Policy: Content on the Website is provided to you AS IS for your information and personal use and may not be sold / licensed / shared on other websites without getting consent from its author. Content is provided to you AS IS for your information and personal use only. Download presentation by click this link. While downloading, if for some reason you are not able to download a presentation, the publisher may have deleted the file from their server. During download, if you can't get a presentation, the file might be deleted by the publisher.

E N D

Presentation Transcript


  1. Corn Outlook

  2. U.S. & Foreign Coarse Grain Production U.S. share of world production: 90-91: 28.1% 08-09: 29.6%

  3. Coarse Grain Production (mmt)

  4. U.S. Corn Acres Planted, 1970-08 2008 was 2nd largest since 1949

  5. U.S. Corn Acres Planted, 1926-08

  6. Million Acres Planted by Crop

  7. Million Acres Planted by Crop

  8. U.S. Soybean/Corn Price Ratio, 1975-09

  9. U.S. Average Corn Yield, 1970-08 Yield is increasing by 2 bu/year

  10. U.S. Corn Production, 1970-08

  11. U.S. Corn Price, 1970-09

  12. US Feed & Residual Use of Corn, 1975-09

  13. U.S. Corn Exports, 1975-09

  14. Corn Exports as % Production, 1975-09

  15. Corn Milled for Ethanol Forecast % corn for ethanol: 2000-01: 6% 2005-06: 14% 2006-07: 20% 2007-08: 23% 2008-09: 30%

  16. On 2/19/09 Mar 09 corn settled at $3.53

  17. Not Tied To Prod Structure of Gov’t Paymentsfor Corn, Sorghum, Barley, Oats, Wheat, Cotton, Rice, Soybean, Sunflowers, Canola, Peanuts Target Price Fixed Payment Trigger Price Counter-Cyclical Payment Loan Rate Loan Deficiency Payment Prod Req.

  18. Farm Bill Payments for Corn • $0.28 times 85% of base production • $2.35 trigger price on 85% of base • $1.95 loan rate on actual bushels

  19. U.S. Monthly Average Corn Price

  20. U.S. Monthly Average Corn Price

  21. March 09 Corn Futures

  22. Nearby Corn Futures

  23. Soybean Outlook

  24. U.S. & Foreign Soybean Production U.S. share of world production: 90-91 50.3% 08-09 35.9%

  25. Soybean Production (mmt)

  26. U.S. Soybean Acres Planted, 1970-08

  27. U.S. Average Soybean Yield, 1970-08 Yield is increasing by 0.45 bu/year

  28. U.S. Soybean Production, 1970-08

  29. U.S. Soybean Exports, 1975-09

  30. U.S. Soybean Price, 1970-09

  31. On 2/19/09 Mar 09 beans settled at $8.84

  32. U.S. Soybean Ending Stocks & Price Crop Year

  33. U.S. Monthly Average Soybean Price

  34. U.S. Monthly Average Soybean Price

  35. March 09 Soybean Futures

  36. Nearby Soybean Futures

  37. Farm Bill Payments for Soy • $0.44 times 78% of base production • $5.36 trigger price on 85% of base • $5.00 loan rate on actual bushels

  38. U.S. Average Farm Price

  39. Asian Soybean Rust http://www.sbrusa.net/

  40. Wheat Outlook

  41. U.S. & Foreign Wheat Production U.S. share of world production: 90-91 12.7% 08-09 10.0%

  42. Wheat Production (mmt)

  43. U.S. Wheat Acres Planted, 1970-08

  44. U.S. Average Wheat Yield, 1970-08 Yield is increasing by 0.24 bu/year

  45. U.S. Wheat Production, 1970-08

  46. U.S. Wheat Exports, 1976-08

  47. U.S. Wheat Price, 1970-09

  48. On 2/19/09 March 09 wheat settled at $5.19

More Related