Download
1 / 10
100 likes | 115 Views
Explore industry clusters in SEMO Region, Missouri, and learn to interpret cluster data results. Analyze mature, transforming, star, and emerging industries for potential growth opportunities.

E N D
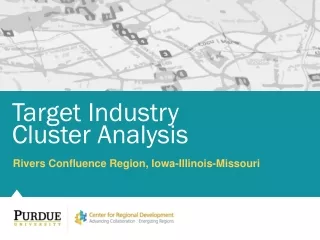
SET Phase V Industry Clusters SEMO Region, Missouri
01 02 Overview Table of contents Industry Cluster Analysis
01 • overview • SEMO Region
SEMO Region Overview • The SEMO region is comprised of four Missouri counties. Ste. Genevieve County forms the border with Illinois. • Iron • Madison • Ste. Genevieve • St. Francois section 01
02 • industry cluster analysis • How to interpret cluster data result • Cluster bubble charts
Industry cluster analysis How to interpret cluster data resultsThe graph’s four quadrants tell a different story for each cluster. Contains clusters that are more concentrated in the region and are growing. These clusters are strengths that help a community stand out from the competition. Small, high-growth clusters can be expected to become more dominant over time. Contains clusters that are more concentrated in the region but are declining (negative growth). These clusters typically fall into the lower quadrant as job losses cause a decline in concentration. Mature Top left (strong but declining) Stars Top right (strong and advancing) Emerging Bottom right (weak but advancing) Transforming Bottom left (weak and declining) Contains clusters that are under-represented in the region (low concentration) and are also losing jobs. Clusters in this region may indicate a gap in the workforce pipeline if local industries anticipate a future need. In general, clusters in this quadrant show a lack of competitiveness. Contains clusters that are under-represented in the region but are growing, often quickly. If growth trends continue, these clusters will eventually move into the top right quadrant. Clusters in this quadrant are considered emerging strengths for the region. section 02 • Modified from: http://www.charlestonregionaldata.com/bubble-chart-explanation/
Cluster bubble chart, 2009-2014 Industry cluster analysis * Note: Label includes cluster name, LQ 2014, and Employment 2014 section 02 • Source: EMSI 2014.4 (QCEW Employees, Non-QCEW Employees, Self-Employed, and Extended Proprietors); Industry cluster definitions by PCRD
Manufacturing sub-cluster, 2009-2014 Industry cluster analysis Star Mature Transforming Emerging * Note: Label includes cluster name, LQ 2014, and Employment 2014; section 02 • Source: EMSI 2014.4 (QCEW Employees, Non-QCEW Employees, Self-Employed, and Extended Proprietors); Industry cluster definitions by PCRD
Industry cluster analysis, 2009-2014 Level of Specialization Percent Growth in Specialization Note: Computer & Electronic Product does not exist; Electrical Equipment & Appliances and Primary Metal Mfg. have too less number of jobs. section 02
Industry cluster analysis Bubble chart interpretation Mature Industries Six industry clusters in the SEMO Region are in the Maturing stage: Mining, Glass & Ceramics, Chemicals/Chemical-based Products, Forest & Wood Products, Fabricated Metal Product Mfg. and Machinery Manufacturing. These industries are relatively concentrated, but their growth is trending downward. It is worth noting, however, that the SEMO Region may find it worthwhile to invest in efforts to shore up the concentration of these industries. Transforming Industries Transforming clusters capture the mix of industries that are experiencing relative decline and limited export capability. In the SEMO Region nine clusters are in this group with Energy, Advanced Materials, Manufacturing Supercluster, and Arts, Entertainment, Recreation & Visitor Industries being the largest by employment. However, any amount of growth in these industries would require relatively large investments. Star Industries Star industry clusters are highly concentrated, exporting and still experiencing growth in the region. The most highly concentrated of the Star industry clusters in the SEMO Region are Agribusiness, Food Processing & Technology, Biomedical/Biotechnical (Life Science), and Transportation & Logistics clusters. Emerging Industries Industry clusters that may be poised for future growth are classified as “Emerging.” There are three clusters in the region: Business & Financial Services, Transportation Equipment Manufacturing, and Information Technology & Telecommunications. section 02 • Source: EMSI Class of Worker 2014.4 (QCEW, non-QCEW, self-employed and extended proprietors).