Download
1 / 26
270 likes | 379 Views
* Rhee, J. and G.J. Carbone. A Comparison of Weekly Monitoring Methods of the Palmer Drought Index. Journal of Climate 20(24): 6033-6044. Percentile: 22.78. Raw data: - 0.75. Percentiles Using Empirical Cumulative Distributions. Total 55 years (1950 ~ 2004)

E N D
* Rhee, J. and G.J. Carbone. A Comparison of Weekly Monitoring Methods of the Palmer Drought Index. Journal of Climate 20(24): 6033-6044.
Percentile: 22.78 Raw data: - 0.75 Percentiles Using Empirical Cumulative Distributions • Total 55 years (1950 ~ 2004) • Palmer indices and SPI: all stations, all months • Streamflow and precipitation: each station, each month Steinmann, A. 2003. Drought indicators and triggers: A stochastic approach to evaluation. Journal of the American Water Resources Association 39: 1217–1233.
No data Interpolation • 4 km X 4 km grids • Available weather stations within a fixed radius circle (i.e. 50 km) • Inverse Distance Weighted; Kriging Rhee, J., G. J. Carbone, and J. Hussey. 2008. Drought index mapping at different spatial units. Journal of Hydrometeorology DOI: 10.1175/2008JHM983.1.
Aggregation Rhee, J., G. J. Carbone, and J. Hussey. 2008. Drought index mapping at different spatial units. Journal of Hydrometeorology DOI: 10.1175/2008JHM983.1.
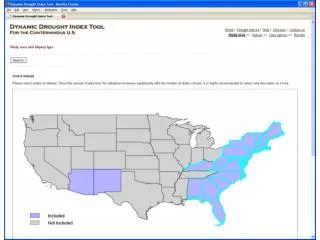
Map Navigation Tools GIS Tools Metadata
Comparisons of multi-maps on one screen Comparing: - spatial layers - indices - months/weeks/days)
Output Options - Scalable vector graphics (SVG) - Arc shapefiles - Google Earth overlay (& KML export) - Excel spreadsheets (for tables)
Structure • ACIS • Applied Climate Information System • NWIS • National Water Information System • ECMAScript • Standardized JavaScript • PHP • PHP: Hypertext Preprocessor • SVG • Scalable Vector Graphics