Download
1 / 24
240 likes | 561 Views
Urban Fieldwork. Exciting and Motivational Geography Dr Viv Pointon. GA Post-16 National Conference, 22 June 2010. Planning fieldwork. Things to consider: Choice of location Health and safety issues Fieldwork strategies Background research Writing up. Decisions, decisions….

E N D
Urban Fieldwork Exciting and Motivational Geography Dr Viv Pointon GA Post-16 National Conference, 22 June 2010
Planning fieldwork Things to consider: • Choice of location • Health and safety issues • Fieldwork strategies • Background research • Writing up
Places to see • Shops and places to eat • Public services • Parks and open spaces • Museums and galleries • Industry and commerce • Transport facilities • Residential areas
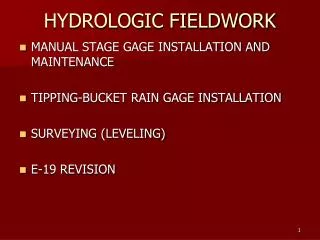
Calculating risk Who is at risk? • Learners • Teachers • Other employees • General public Probability of occurrence: • Unlikely • Rarely • Infrequently • Sometimes • Often Worst case outcome: • Inconvenience • Minor injury • Injury/illness • Major injury • Fatality Risk rating = Worst case outcome x probability of occurrence PLAN YOUR RESPONSE!
Using photographic images • Find photos of your fieldwork area from http://www.geograph.org.uk (just key in the grid square). • Or use Google Earth to focus on the study area. • Other images may also be found on the local council website. • Or visit the area before, take photos and show these in class. • Print and laminate photos for group work – encourage students to identify features that could be investigated.
Pedestrians Traffic Shops/business Bi-polar analysis CBD models Microclimate Building material Street furniture Things to study • Disabled access • Building design • Sound mapping • Urban art
Getting started… Identify and define key concepts and/or processes: • Is there a relevant theory or model? • What processes are shaping the area? • What are the variables that can be measured? eg: Core-frame models • redevelopment • pedestrian flows • zonation or quarters
Data collection strategies Locate the study area Delimiting the area Using appropriate maps Identify methods to investigate the question or hypothesis Prepare questionnaires and log sheets Carry out pilot surveys In the classroom In the school grounds At home Identify sampling methods Random, systematic, stratified? How many responses? Describe and justify these methods Learners should make notes from the outset
Doing what works • Effective fieldwork is student-centred not teacher-led. • Learners should be able to take ownership of their fieldwork. • This will enable them to respond the requirements of the assessment more effectively. • Use qualitative and ethnographic methods of data collection as well as more traditional quantitative methods.
Preparation: Things learners can do: • Write down descriptive words – first impressions? • Take photographs – what would you see? • Note land uses – what wouldn’t you see? • Listen – what would you hear? • Assess light and lighting – how safe is it? • Study buildings – age, design, materials? • Consider accessibility – can a buggy get there?
Sampling Sampling strategies: Random (numbers generated using chart or calculator) Systematic (select an appropriate and representative sample) Stratified (select proportionate amounts from more than one area or population) See http://www.s-cool.co.uk/alevel/sociology/methods/sampling-methods.html for good advise on sampling methods.
Using equipment Sound – use noise meters to gather data for sound pattern maps Light – this can affect pedestrian flows (sunny side of street or defensible space) Distance – measure length of shop fronts, distance to car parks (tapes, pacing, large-scale maps or GPS) Ecology – simple quadrat and transect surveys will work in parkland, copses and playing fields Microclimate – measure wind speed and direction and wet and dry bulb temperatures Pollution – (as well as noise meters) monitor acidity of rainfall, survey particle deposition, or the pollution of an urban water course
Most learners now have digital cameras on their mobile phones Use both wide angle and close-up shots Monitor change over time Assess flow volumes Use video sequences Using photography
Secondary data sources • Local libraries have reference sections which may still have very useful map resources (such as Goad plans) and planning documents. • Other useful organisations may include your local university, environmental pressure groups, tourist information offices, etc. • Online resources are dependent on what the local authority provides but can be a rich source of information.
Online data sources • http://www.statistics.gov.uk/hub/regional-statistics/ index.html - for census and other official data. • See also local authority websites with useful links. • See ratinglists/voa.gov.uk for rateable values for business properties. • See http://www.visionofbritain.org.uk for data and graphs using earlier census data. • Find property values at http://www.houseprices.co.uk. • Use http://www.upmystreet.com/local/neighbours for ACORN profiles. • See also insurance quote websites for comparisons of similar properties.
Producing a report: Data Presentation Analysis and Interpretation Conclusion and Evaluation http://www.ocr.org.uk/download/sm/ocr_13331_sm_gce_unit_f764.docis very useful
Data Presentation • Learners should know how to collate and sort the information collected and how to present it in appropriate ways. • They should record what they have learned and what the information shows. • Limitations and improvements should be identified at every stage. • See http://www.smashingmagazine.com/2007/08/02/data-visualization-modern-approaches/ for some really wacky inspiration!
Using simple ICT (Excel) Determine the most effective methods.
Analysis and Interpretation Learners should know how to describe, interpret and analyse their results. Suitable quantitative techniques include: Mean, median and mode Percentages Inter-quartile range Standard deviation Nearest neighbour analysis Mann Whitney U test Spearman rank correlation Chi squared analysis
Learners should be able to relate their conclusions to their results and initial question or hypothesis. They should identify any problems encountered in carrying out the research. They should comment on the accuracy of their results and the validity of the conclusions. And they should know ways in which the investigation may be improved and extended. Conclusion and Evaluation
Is Geography about fieldwork?Or is fieldwork about Geography?
How many field trips have killed learners’ interest in Geography?How many learners have you seen come alive on a field trip?
Fieldwork should inspire, enthuse and energise learners…it is worth much more than a means to an end for assessment!