Download
1 / 1
10 likes | 101 Views
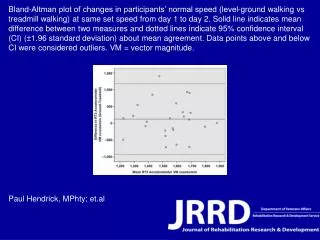
This Bland-Altman plot compares the changes in participants' normal walking speeds on level-ground and on a treadmill at the same set speed from day 1 to day 2. It shows the mean difference and 95% confidence interval with outliers marked. The study includes vector magnitude analysis. Original work by Paul Hendrick, MPhty, et al.

E N D
Bland-Altman plot of changes in participants’ normal speed (level-ground walking vs treadmill walking) at same set speed from day 1 to day 2. Solid line indicates mean difference between two measures and dotted lines indicate 95% confidence interval (CI) (±1.96 standard deviation) about mean agreement. Data points above and below CI were considered outliers. VM = vector magnitude. Paul Hendrick, MPhty; et.al