Measurement
This topic covers the mapping theory and process of measurement, sources of error in measurement, what to do about error, and practical ways to improve measurement. It also discusses data collection and entry. Examples of measures and indicators are provided, along with scaling and reliability techniques.

Measurement
E N D
Presentation Transcript
Measurement 17.871 Spring 2007
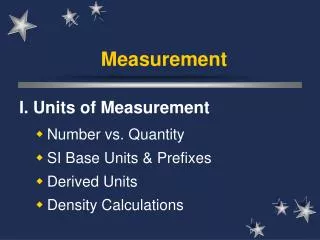
Topics • From abstraction to measure • Sources of error • What to do about error • Practical ways to improve measurement • Data collection and entry
The Mapping Theory Y X y x Observation ey ex
Mapping from the Abstract to the Measurement • Some abstract things we try to measure • Alienation • Traditional morality • Democracy • Party identification • Fear of defeat • Terrorism • Ideology
Sources of Error in Measurement • Random versus systematic • Conceptual or design error • Survey question wording • Transcription, calculation & mechanization errors
What to Do About Error • Practice safe data • Know where your data come from • Watch for anomalies • Use multiple measurement techniques • Collect as much data as possible and disaggregate
Practical things to do about measurement • Distinction between a measure and an indicator • Measure: straightforward quantification of a variable of interest • Indicator: quantification of a variable that is believed (or known) to be highly correlated with the “real” variable of interest
Examples of Measures • Income in $$ • Age in years • Votes • Number of wars • Campaign contributions • Measurement issues tend to focus on the quality of the data-gathering method, especially sampling – e.g., Iraqi deaths
Examples of Indicators • Most measures are really indicators • Public opinion • Party identification • Trust in government • Ideology • Economics • Gross domestic (national) product • Characterizations of political systems • Freedom • Transparency • Democracy • Quality of colleges
How do we generate indicators? • Trust others and hope for the best • GDP, etc. • Presidential approval • Use a single measure and hope for the best 7-point ideology scale • 7-point party identification scale • Codings of “wars” or “rally events” • Bulletin of the Atomic Scientist “nuclear clock” • US News and World Report ranking of colleges • Use multiple measures creatively
Multiple-measure indicators • “Moral traditionalism” battery
Other Multiple-Variable Indicators • Americans for Democratic Action Support Scores • Freedom House freedom assessment • MIT Teaching Quality • Transparency International’s “Corruption Perceptions Index” • DNominate Scores
Imagine an unobserved factor that gives rise to observable factors Measure 1 e1 b1 • Democracy • Healthiness • Personal financial condition • Conservatism • Religiosity • Teaching quality • College quality • Racism Measure 2 e2 Unobserved factor b2 . . . bn Measure n e3 Fairness of elections e1 b1 Meaningfulness of elections e2 Democracy b2 b3 Freedom of expression e3 b4 Unbiased reporting of official pronouncements e4
Scaling and Inter-correlation • Check whether observed factors are correlated • In Stata: use corr [variables] • The usual rule is above .3 • Check that the items fall on one factor with underline that • In Stata: use factor [variables], pcf • Eigenvalues above 1 may indicate an unobserved factor • Look for factors with eigenvalues much larger than other factors • Factor loadings should be above .5 for variables on the observed factor and below .3 on other factors • These rules are suggestive
Warning • Exploratory analysis is dangerous, be wary • E.g., survey questions that ask for agreement can fall on different factors than if the the same questions ask about disagreement • Best used to confirm expectations
Scaling and Reliability • Cronbach's α (alpha) measures reliability • Indicates the extent to which items can be treated as measuring a single latent variable (Wikipedia, 2007)
Scaling and Reliability • Reliability should be above 0.6 • i.e., less than 40% of the variance is error • In Stata, use alpha [variables], item • Each item should contribute to reliability
Generating the Scale • Create index using Stata commands • generate • egen • alpha [variables], item g([new scale variable]) • Warning, these commands differ in • how they treat missing data • whether they reverse the direction of the variables
Instructions for data entry • The first entry in a column should be a unique variable name that describes the variable, e.g., “vote” • Variable names and data should have • no spaces and • No special characters (e.g., \,$,*,@, #) • Data should always be entered numerically (e.g., Republican vote coded to 1, Democratic vote coded to 0), unless data are unique strings, e.g., proper names
Instructions for data entry • Each column should code for a single variable • If concepts have multiple components, try to break them into separate variables • E.g., if you are interested in Democratic incumbents versus Republican incumbents, code the party as one variable and incumbency as another • In Excel, format the columns as numbers, not dollars or percentages • Include the source information for variables in the same file as a comment on the cell, on a separate sheet or page, or to the left of the data columns • Whenever possible, both print or photocopy the source of the data and save the source in the same folder as the data