Download
1 / 22
220 likes | 363 Views
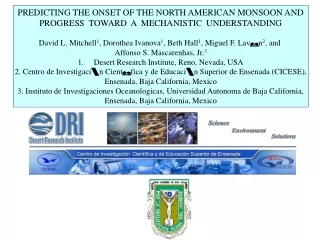
Stephen W. Bieda III , Steven L. Mullen, Christopher L. Castro University of Arizona Department of Atmospheric Sciences. Transient inverted troughs interacting with the north american monsoon system. Motivation for Research.

E N D
Stephen W. Bieda III, Steven L. Mullen, Christopher L. Castro University of Arizona Department of Atmospheric Sciences Transient inverted troughs interacting with the north american monsoon system
Motivation for Research • Collaborative effort between National Weather Service, Tucson, AZ WSFO and the University of Arizona Dept. of Atmospheric Sciences. • To provide an overview of inverted troughs, which are important synoptic scale features related to monsoon rainfall. • Continued work from Pytlak et al. (2005), and analysis conducted during 2003-2005. • These were also focused on during the NAME field campaign.
NAME Regions Tier I and II Source: NAME Science Plan 2004
Definition of Inverted Trough • Cyclonic circulation moving in a general westward direction across the NAME Tier I region. These are features in the middle and upper-troposphere with maximum vorticity occurring above 500 mb, and are typically “cold core” in nature (i.e. 500mb temps below -6C). Source: NAME Science Operation Plan (2004)
Conceptual Model of IV’s Source: Pytlak et al. (2005)
Datasets • Time Frame: May 15 – September 30 • Years covered: 1980 – 2006 • Primary Datasets Used: • North American Regional Reanalysis (1980-2006): 3 hour time resolution • Lightning Data, courtesy of VAISALA, Inc whose months were constrained to June 1 – Sept 30 (1996-2005): 1 hour time resolution • Secondary Datasets Used: • NOAA Daily Weather Maps (1980-2006) • SPC Upper Air and Surface Archive Datasets (2002-2006) • NAME data archives (2004 field campaign) • Most of the datasets were used as a sanity check against NARR. Region covered: • NARR - boundaries were 10N – 42N, 122W – 90W (basically NAME Tier II). • Lightning Data –boundaries were 27.5N-40N, 120W-100W.
Definitions • IV days – for the lightning composite, days that an inverted trough passed north of 23N, and between 100W and 120W. • CPVM – Combined Pacific Variability Mode: uses the two (2) rotated EOFs of global SSTs which are associated with interannual and interdecadal variability in the tropical Pacific Ocean. Has a known relationship with NAMS variability at onset. (referenced in Castro et al. 2007, J. Climate)
CPVM Source: Castro et al. (2007)
Methods of Analysis • Lightning composites for IV days and non-IV days every hour were compared using a difference of means test for local significance and a field significance test (e.g. Livezey and Chen 1983). • Track density composites for CPVM negative and positive years were compared using the same method as above. The lightning and Tier II regions considered.
IV Tracks This is an example, using Douglas and Englehart (2006) classification.
Plotting Track Densities • The primary mechanism for identifying the IV’s will be through the use of the NARR’s 250mb, 300mb, 500mb and 700mb heights, 500mb temperature and relative vorticity by way of identifying a distinguishable upper-tropospheric (or lacking that, mid to lower tropospheric) center. • Lacking any distinguishable center, relative vorticity will be used to help identify a region within the trough itself. • Lacking the prior two, a discernible inverted trough in the easterlies (using the 500mb geopotential height 585 dm line or as close to that as possible). • After applying the above methods, an equation using lat-lon points was applied where 1 was the center, and a distance of 1 degree (approx. 4Δx of NARR) from the lat-lon point was zero.
Climatological Track Density Jun 4 Jun 19 Jul 4 Jul 19 Aug 4 Aug 19
Track Density Difference(CPVM Neg – Pos Yrs) Jun 4 Jun 19 Jul 4 Jul 19 Aug 4 Aug 19
Corresponding T-stat at 90%+ Jun 4 Jun 19 Jul 4 Jul 19 Aug 4 Aug 19
Model Precip w/CPVM (Castro et al. 2007) CPVM Positive – CPVM Negative Years showing the same basic principle.
Discussion • Inverted Troughs bring the necessary mechanisms (divergence aloft, instability, possible Gulf Surges) to enhance the diurnal cycle during the monsoon. • The enhancement caused by these IVs are most pronounced and statistically significant during the hours of 18z – 09z.
Discussion • From the standpoint of diagnosing interannual variability, the CPVM is a powerful tool for forecasters in the NAM region. • Transient IVs from a climatological standpoint track over central Mexico, and tend to reach a maximum just south of Baja California. • During CPVM negative years, these tracks are either enhanced (+1 track/year) or deviated more northerly until around August (Julian Day 215). This enhances the rainfall in the core monsoon region.
Conclusions • Transient IVs are pronounced features of the NAMS that enhance the diurnal cycle and account for a large portion of the lightning activity over only a third of the days in the analysis period. • From a long term standpoint, knowing what the CPVM index is will give a good sense of how many and where the IVs will track during the upcoming monsoon season. This year it worked very well as it was very wet in Tucson in July! …I was also very OVERWORKED…
Acknowledgements • Drs. Mullen and Castro for serving as my co-Advisors and providing their expertise. • Mr. Pytlak for his collaboration with this research. • Dean Comrie for taking time out of his extremely busy schedule to provide input and serve on my committee. • Dr. Cummins for allowing our group access to lightning data. • Angel Otarola for helping me with MATLAB concerning NARR datasets.
Questions or Comments? • Thank you for your time!