Download
1 / 38
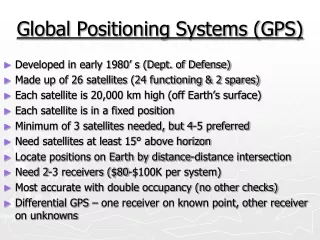
450 likes | 798 Views
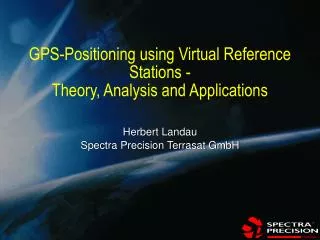
GPS-Positioning using Virtual Reference Stations - Theory, Analysis and Applications. Herbert Landau Spectra Precision Terrasat GmbH. Overview. Principle of Virtual Reference Stations Modelling of Error Sources Hardware Setup Software Setup Implementations - References

E N D
GPS-Positioning using Virtual Reference Stations - Theory, Analysis and Applications Herbert Landau Spectra Precision Terrasat GmbH
Overview • Principle of Virtual Reference Stations • Modelling of Error Sources • Hardware Setup • Software Setup • Implementations - References • Results of RTK Positioning Analysis
Improvement of accuracy versus classical RTK Reliability improvement Productivity improvement Local reference station is obsolete Positions are automatically derived in a precise geodetic reference station system Real-time service for ionospheric disturbances can be provided to the user Why Virtual Reference Stations?
Concept of Virtual Reference Stations (VRS) • Modeling systematic errors • Elimination of errors • Generation of interpolated observations for virtual station • Real-Time: RTCM • Post-Mission: RINEX B Virtual Ref. C Rover D A
Reference Station Reference Station Reference Station Reference Station Router GPS Network Data Flow in the Network Raw Data
Reference Station Reference Station Reference Station Reference Station Router GPS Network Data Flow in the Network Raw Data LAN Rover
Reference Station Reference Station Reference Station Reference Station Router GPS Network Data Flow in the Network Raw Data LAN NMEA Position
Reference Station Reference Station Reference Station Reference Station Router GPS Network Data Flow in the Network Raw Data LAN NMEA Position
Reference Station Reference Station Reference Station Reference Station Router Virtual Ref. Station GPS Network Data Flow in the Network Raw Data RTCM LAN NMEA Position
Major Error Sources in Differential-GPS Ionosphere Error in Satellite Orbit Troposphere
Modified Hopfield Model Ground meteorological measurements not sufficient Water Vapour Radiometers are too expensive Elimination of tropospheric errors is required for ambiguity resolution in the network Determination of a model scale factor Tropospheric Modelling
Tropospheric Scale Factor Convergence on the Network Stations Scale factor offset Minutes
Improvement due to Tropospheric Scaling in the Bysat Network
Single layer model Determination from L1/L2 carrier phase data All data of all stations The correction by the model is applied to the observations This is required for wide lane ambiguity fixing Ionospheric Modelling
Solar Cycle and Ionosphere Average yearly number of sun spots 200 150 RZ 100 50 0 1960 1970 1980 1990 2000 25 Ionospheric error in GPS L1 20 15 Error [m] 10 5 0 1960 1970 1980 1990 2000 Year
Ionospheric Maximum in 2000/2001 35 30 CODE Ionospheric model Station Zimmerwald, CH 25 20 Mean TEC (TECU) 15 10 5 1995 1995,5 1996 1996,5 1997 1997,5 1998 1998,5 1999 1999,5 2000 2000,5 Time (Years)
0.06 0.05 0.04 0.03 0.02 0.01 0.00 -0.01 -0.02 -0.03 -0.04 -0.05 -0.06 13:00 13:10 13:20 13:30 13:40 13:50 14:00 Differential Ionosphere Dec. 1998 on 70 km Baseline Error in Meter Local Time
0.25 0.20 0.15 0.10 0.05 0.00 -0.05 -0.10 -0.15 -0.20 -0.25 13:00 13:10 13:20 13:30 13:40 13:50 14:00 Differential Ionosphere Feb. 1999 on 70 km Baseline Error in Meter Local Time
0.50 0.40 0.30 0.20 0.10 0.00 -0.10 -0.20 -0.30 -0.40 -0.50 13:00 13:10 13:20 13:30 13:40 13:50 14:00 Differential Ionosphere Feb. 2000 on 70 km Baseline Error in Meter Local Time
Starting with broadcast ephemeris Additional use of predicted ephemeris Comparison of broadcast and predicted ephemeris Typical differences < 10 m Differences of up to several 100 m can be found during satellite maneuvers Satellites with large differences are not used Estimation of residual error Satellite Orbits
Outlier detection in pseudo-ranges Continuous navigation solution for all stations Continuous DGPS solution for all stations In case of outliers the epoch will not be used Integrity Monitoring
Geometric correction Correction for tropospheric errors Correction for ionospheric errors Correction for multi-path Ambiguity resolution Consistency check Network Processes
Estimation of corrections from residuals in L1 and L2 carrier phase measurements Correction in North-South and East-West direction for each satellite for geometrical part (troposphere and ephemeris), typical < 2 ppm ionospheric part, typical < 15 ppm Computation of corrections performed once per second Derivation of Corrections
Starting with the data of the reference station nearest to the rover Geometric displacement of these data to the virtual position Applying the corrections for the geometric and the ionospheric parts Transmission of the VRS data via mobile-phone in RTCM Standard with messages 3, 18, 19 Computation of VRS-Data
The Bysat Network in Germany • Ashtech • 9 Stations • 50-70 km • Telekom • Net Router • Access Server Weinstadt Mainburg Gerstetten Augsburg Neufahrn Münsingen Untereichen Mühldorf Höhenkirchen
Performance Analysis in the Bysat Network • Data of February 2000 • 90 hours day/night • Rover in Neufahrn, 32 km • from Höhenkirchen Mainburg Mühldorf Augsburg RoverNeufahrn Höhenkirchen 70 km
Recorded data of Dec. 6th, 1999 13:30-15:12 local time on rover station Neufahrn VRS data generated in real-time was recorded Post-processing with Geotracer RTK-Software on PC Automatic OTF search with intervals of 15 seconds Sequential adding of data until ambiguity resolution is successful Comparison of Standard RTK with VRS-RTK
Operation of rover Neufahrn (32 km from the nearest reference station) with Geotracer RTK system After each fix the Geotracer RTK system outputs position data for 30 seconds After that the RTK system initializes the ambiguity search again, no data from the past is used All position output is stored on an extra PC and analyzed statistically Real-Time Test Setup in the Bysat Network
Error in North – 32 km Baseline Confidence Level 90 %: < 13 mm 99 %: < 26 mm
Error in East – 32 km Baseline Confidence Level 90 %: < 9 mm 99 %: < 21 mm
Error in Height – 32 km Baseline Confidence Level 90 %: < 25 mm 99 %: < 49 mm
RTK Initialisation – 32 km Baseline Performance 50 %: < 40 sec 90 %: < 80 sec average: 58 sec
Bysat Network – 32 km : 11AM – 4PM 90 % < 17 mm 99 % < 37 mm Average 60 seconds
GPS-Network successfully creates improved VRS RTCM corrections in real-time VRS reduces systematic errors substantially, but cannot eliminate them completely VRS allows to do RTK positioning at distances a standard RTK system never will reach Virtual Reference Stations improve: Accuracy Productivity via shorter Time to Fix Reliability Conclusion