Download
1 / 87
980 likes | 1.34k Views
IEES - BAS. Centre of Excellence. e - School. DIFFERENTIAL IMPEDANCE ANALYSIS - Theory and Applications. D. Vladikova, Institute of Electrochemistry and Energy Systems, Sofia, Bulgaria; d.vladikova@bas.bg. IEES - BAS. Centre of Excellence. ABOUT THE E-SCHOOL

E N D
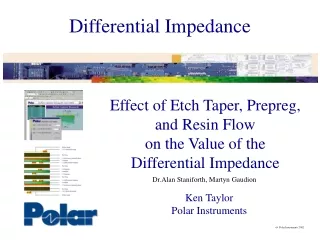
IEES - BAS Centre of Excellence e - School DIFFERENTIAL IMPEDANCE ANALYSIS - Theory and Applications D. Vladikova, Institute of Electrochemistry and Energy Systems, Sofia, Bulgaria; d.vladikova@bas.bg
IEES - BAS Centre of Excellence ABOUT THE E-SCHOOL This e-School can be regarded as a specialized course from the group of POEMES “cd” training courses, which concerns some modern aspects in the development of the Electrochemical Impedance Spectroscopy (EIS). It introduces the technique of the Differential Impedance Analysis (DIA), developed recently in IEES. This novel and advanced method for data analysis contributes to the increase of the Electrochemical Impedance Spectroscopy’s information potential. Organized for Ph. D. students and scientists applying Impedance for energy sources studies, the course can be also interesting for researchers who use this technique in other scientific fields. The application of DIA is demonstrated on example of YSZ (single crystal and polycrystalline) solid electrolyte and Lead Acid Electrode. The DIA references are linked to the corresponding abstracts.
IEES - BAS Centre of Excellence REFERENCES (for DIA) • Z. Stoynov, D. Vladikova, “Differential Impedance Analysis”, Marin Drinov Academic Publishing House, Sofia, 2005. • D. Vladikova, Z. Stoynov, J. Electroanal. Chem. 572 (2004) 377. • D. Vladikova, Z. Stoynov, M. Viviani, J. Europ. Ceram. Soc. 24 (2004) 1121. • D. Vladikova, http://accessimpedance.iusi.bas.bg, Imp. Contribut. Online 1 (2003) L3-1; Bulg. Chem. Commun. 36 (2004) 29. • G. Raikova, D. Vladikova, Z. Stoynov, http://accessimpedance.iusi.bas.bg, Imp.Contribut. Online, 1 (2003) P8-1; Bulg. Chem. Commun. 36 (2004) 66. • D. Vladikova, P. Zoltowski, E. Makowska, Z. Stoynov, Electrochim. Acta(2002) 2943. • Z. Stoynov, Proc. 15ème Forum sur les Impedances Electrochimiques, 9 décembre 2002, Paris, France, p. 3. • Z. Stoynov, H. Takenouti, M. Keddam, D. Vladikova, G. Raikova, Proc. 15ème Forum sur les Impedances Electrochimiques, 9 décembre, 2002, Paris, France, p. 235. • Z. Stoynov, in: C. Julien, Z. Stoynov (Eds.), Materials for Lithium-Ion Batteries, Kluwer Academic Publishers, 3/85, 2000, 371.
IEES - BAS Centre of Excellence REFERENCES (for DIA) • Z. Stoynov, Polish. J. Chem. 71 (1997) 1204. • Z. Stoynov, Electrochim. Acta 35 (1990) 1499. • Z. Stoynov, Electrochim. Acta 34 (1989) 1187. • 13. D. Vladikova, J.A. Kilner, S.J. Skinner, G. Raikova, Z. Stoynov, Electrochim. Acta, in press • 14.A. Barbucci, M. Viviani, P. Carpanese, D. Vladikova, Z. Stoynov, Electrochim. Acta, in press
IEES - BAS Centre of Excellence BASIC ABBREVIATIONS Ad additive term C capacitance Cdl double layer capacitance CNLS complex non-linear least squares D data set 2-D two-dimensional CNLS complex nonlinear least squares CPE constant phase element ct charge transfer DIA differential impedance analysis dl double layer
IEES - BAS Centre of Excellence BASIC ABBREVIATIONS FRA frequency response analyzer gb grain boundary IEES Institute of Electrochemistry and Energy Systems Im imaginary component of the impedance L inductance LOM local operating model M model MRND modified Randles model Par. parameter Par.Ident. parametric identification R resistance
IEES - BAS Centre of Excellence BASIC ABBREVIATIONS EIS electrochemical impedance spectroscopy Rct charge transfer resistance Re real component of the impedance Rel electrolyte resistance RND Randles model SOFC solid oxide fuel cells S.T. spectral transform Str.Ident. structural identification T time-constant W Warburg impedance YSZ yttria stabilized zirconia Z impedance
IEES - BAS Centre of Excellence • CONTENTS • WHY DIA?? (Introduction) • 2. PRINCIPLE OF DIA • 2.1. Structural Identification • 2.2. Local Operating Model (LOM) • 2.3. DIA Procedure • 2.4. Noise Immunity • 3. SECONDARY DIA • 5.1. Recognition of CPE • 5.2. Recognition of Randles Model • 5.3. Recognition of a Simple Faradaic Reaction with Capacitive CPE • 4. DIA APPLICATION ON YSZ Solid Electrolyte
IEES - BAS Centre of Excellence • 1. WHY DIA?? • (Introduction) • To answer on this question, we should have to make a small promenade in the classical EIS (more info about the classical impedance data analysis can be found in the prerequisite e-school “abc” Impedance). • The power of the EIS lies in its unique capability for separation of the kinetics of different steps comprising the overall electrochemical process as well as in the detailed information obtained about the surface and the bulk properties of a wide spectrum of electrochemical systems and phenomena, including power sources. • Since the method does not ensure the direct measurement of a physical phenomenon, the interpretation of the experimental data, however, demands the construction of an impedance model.
IEES - BAS Centre of Excellence • WHY DIA?? • (Introduction) • The identification of the impedance model follows some obligatory • steps, which are presented schematically on • page 12: • The model structure is assumed a priori, i.e. one or more hypothetical models are chosen; • The most probable combination of the model parameters is evolved by parametric identification; • The degree of proximity between the model and the object’s impedance is a measure for the model validity.
IEES - BAS Centre of Excellence 1. WHY DIA?? (Introduction) There are many works devoted to improvements in the procedures for parametric identification and model validation (see “abc Impedance”), BUT the principal subjectivity, set in the “choice of a hypothetical model”, can not be avoided. The Differential Impedance Analysis is a novel and advanced technique for impedance data processing, which increases the information potential of the EIS, introducing the more powerful and objective “structural identification”. It does not require an initial working hypothesis and the information about the model structure is extracted from the experimental data:
IEES-BAS Centre of Excellence Choice of a Hypothetical Model STRUCTURAL APPROACH D I A Parametric Identification • Model Validation: • Model simulation: • Choice of criterion of proximity between the initial and estimated data: • Analysis of the residuals: ParametricIdentification
IEES-BAS Centre of Excellence 2. PRINCIPLE OF DIA 2.1. StructuralIdentification The structural identification approachutilizes the impedance data to identify both the structure S and the parameters Pof the model Mand thus to eliminate the necessity for initial working hypothesis : The operator Str. Ident. symbolizes the structural identification, which includes the parametric one. The procedures of the DIA start with the initial 3 D set of experimental data (angular frequency,real and imaginarycomponents of the impedance): D3 [ Rei, Imi, ωi]
IEES-BAS Centre of Excellence 2. PRINCIPLE OF DIA Scanning Local Analysis The kernel of the DIA is the scanning local analysis - a combination of a scanning procedure with a local parametric analysis. The procedure is based on a consecutive analysis of the experimental data by applying a local estimator moving along the analytical coordinate. In the Impedance Spectroscopy a preliminary selected model, called local operating model (LOM), is used as a local estimator, while the frequency is recognized as an analytical coordinate. Scanning Local Analysis Local Parametric Identification Scanning with a Local estimator - Local Operating Model (LOM) (scanning axis - w) +
IEES-BAS Centre of Excellence CPE Rad C Rad R2 R 2. PRINCIPLE OF DIA Local Operating Model DIA operates with a LOM, represented by a simple first order inertial system, extended with an additive term. Its transfer function follows the First Cauer Form: H(p) = A + B/(1 + pt ) The simplest electrical equivalent is a mesh of resistance R and capacitance C in parallel, extended with additive term Adconnected in series. Since in electrochemical systems the resistance of the electrolyte is observed very often at high frequencies, this additive term may be accepted to be a resistance Rad. The effective time-constant T = RC is also introduced as a parameter.
IEES-BAS 2. PRINCIPLE OF DIA Centre of Excellence DIA Procedure I Scanning with the LOM in the whole ω range I. Scanning with the LOM throughout the whole frequency range with a scanning window of a single frequency point; II. Parametric identification of the LOM at every working frequency; III. Frequency analysis of the LOM parameters’ estimates.
IEES-BAS 2. PRINCIPLE OF DIA Centre of Excellence DIA Procedure ˆ ˆ ˆ ˆ ˆ Þ P R , C , R , T LOM ad ˆ P LOM = Par. Id [ D3 (ωi,Re i,Imi,) ] II.LOM Parametric Identification Since the scanning identification window width is equal to one frequency point, the application of a deterministic approach is necessary. The number of the independent data available inside the observation window is smaller than the number of the unknown parameters and the initial 3 D setof impedance data is extended with two additional terms - the derivatives of the real and imaginary components of the impedance with respect to the frequency. As a result a new five dimensional set of data is obtained and the LOM parameters’ estimatesare determined at every frequency. d Rei/d wid Imi/d wi
IEES-BAS Centre of Excellence (1) (2) (3) R Rad (4) C (5) (6) (7) New data set : 2. PRINCIPLE OF DIA - DIA Procedure II.LOM Parametric Identification Impedance of the LOM V is the vector of the parameters
IEES-BAS 2. PRINCIPLE OF DIA Centre of Excellence DIA Procedure III.Frequency analysisof the LOM parameters’ estimates. III Frequency Analysis ofthe LOM Parameters Estimates LOMf (w) Determines the model structure ˆ P The analysis of the LOM parameters’ estimates frequency behaviour , which can be performed in different ways, provides for the structural and parametric identification of the impedance model. Every form of representation emphasizes specific parts of the model structure and thus their combination ensures a more complete and precise identification.
IEES-BAS 2. PRINCIPLE OF DIA Centre of Excellence DIA Procedure III.Frequency analysisof the LOM parameters’ estimates. (8) where Tf = 1/f and f is the frequency As far as Tf represents the time interval of perturbation, the function is a temporalone and the corresponding analysis is termedtemporal analysis. For its further implementation the following notation will be used: (9) contains the decimal logarithms of the parameters : where the vector ; ; ; and The new experimentaldata set is: (10) 1. Temporal Analysis – direct recognition of lumped parameters
IEES-BAS Centre of Excellence 2. PRINCIPLE OF DIA - DIA Procedure III.Frequency analysisof the LOM parameters’ estimates. Temporal Analysis – graphical presentation The temporal analysis displays the functional dependencies of Eqn. (8). in two types of plots – temporal plots and spectral plots. Temporal plots In the frequency regions, where the LOM corresponds to the object’s behaviour, i.e. to a sub-model with a structure of a time-constant (R and C in parallel connection – Example 1), the dependencies described by Eqn. 8 are frequency invariant and their temporal plots exhibit plateaus. In Examples 2 - 4 the object is a Faradaic reaction involving one adsorbed species, i.e. the reaction has two steps and the observed plateaus are also two. They are separated by regions of frequency dispersion, which in this case correspond to the transition between the two reaction steps. To summarize :the presence of plateaus ensures the recognition of the model, while their position enables the parametric estimation.
IEES-BAS Centre of Excellence Object Impedance Temporal plot Example 1 – simple Faradaic Reaction C R C C R R CPE Example 2– Faradaic Reaction involving one adsorbed species (I) R1 R2 2. PRINCIPLE OF DIA - DIA Procedure III.Frequency analysisof the LOM parameters’ estimates. Temporal Analysis – graphical presentation Temporal plots ( α ,r, c, τ)
IEES-BAS Centre of Excellence Object Impedance Temporal plot Example 3– Faradaic Reaction involving one adsorbed species (II) C C R R C C R R R R Example 4– Faradaic Reaction involving one adsorbed species (III) 2. PRINCIPLE OF DIA - DIA Procedure III.Frequency analysisof the LOM parameters’ estimates. Temporal Analysis – graphical presentation Temporal plots ( r, c, τ)
IEES-BAS Centre of Excellence The Spectral presentation (analysis) offers an enhanced performance of the results obtained by the temporal analysis. It displays the dependencies of Eqn. 8 in the more informative spectral form Sj, which reveals the presence of a different number of time-constants: where j denotes the corresponding parameter and S.T. symbolizes the spectral transformation procedure, which converts the plateaus of the temporal plots into spectral lines. (11) 2. PRINCIPLE OF DIA - DIA Procedure III.Frequency analysisof the LOM parameters’ estimates. Temporal Analysis – graphical presentation The temporal analysis displays the functional dependencies of Eqn. (8). in two types of plots – temporal plots and spectral plots. Spectral plots
IEES-BAS Centre of Excellence The simplest spectral transform can be regarded as a construction of an ordinary histogram. The parametric spectra are obtained by accumulating frequency bands with approximately equal values of the parameter . The intensity of the individual spectral peaks is estimated by introducing a dB grid, where an intensity of 10 dB corresponds to a frequency band of one decade. Since the spectral representation takes into account the frequency spacing of the real data, the amplitude of the spectral line is proportional to the length of the frequency interval where a given phenomenon is well pronounced. To summarize :The spectral presentation transforms the temporal plateaus into spectral peaks. The number of spectral lines gives the number of time-constants (R/C meshes) in the model. The position of the spectral lines defines the value of the corresponding parameter. 2. PRINCIPLE OF DIA - DIA Procedure III.Frequency analysisof the LOM parameters’ estimates. Temporal Analysis – graphical presentation Spectral plots
IEES-BAS Centre of Excellence Object Temporal plot Spectral plot Example 1 – simple Faradaic Reaction C R C C R R CPE Example 2– Faradaic Reaction involving one adsorbed species (I) R1 R2 2. PRINCIPLE OF DIA - DIA Procedure III.Frequency analysisof the LOM parameters’ estimates. Spectral Transform ( α ,r, c, τ)
IEES-BAS Centre of Excellence Object Temporal plot Spectral plot Example 3– Faradaic Reaction involving one adsorbed species (II) C R C R R Example 4– Faradaic Reaction involving one adsorbed species (III) 2. PRINCIPLE OF DIA - DIA Procedure III.Frequency analysisof the LOM parameters’ estimates. Spectral Transform ( r, c, τ)
IEES-BAS Centre of Excellence C1 R C2 R1 Example on synthetic model of Faradaic Reaction involving one adsorbed species: R2 • Simulation of noise – by truncation; • Simulation of non-Gaussian noise – by introduction of a “wild point” via 10% increase of Re. T1 = R1C1 T1 = R2C2 q = T2/T1 = 0.001 2. PRINCIPLE OF DIA - DIA Procedure Spectral Transform – Noise Immunity The spectral transform plays the role of a consecutive integration, since the intensity of an individual spectral peak is proportional to the length of the frequency interval where the corresponding parameter’s estimate has close values. Thus the spectral transform provides for data stratification and for efficient filtration of non-statistical noise, because the presence of an outlier introduces only a fuzzy low intensity line, located away from the spectral kernel of the basic phenomenon.
IEES-BAS Centre of Excellence 7 digits Truncation to 4 digits 4 digits +wild point 2. PRINCIPLE OF DIA - DIA Procedure Spectral Transform – Noise Immunity Impedance diagrams q = T2/T1 = 0.001
IEES-BAS Centre of Excellence 7 digits 4 digits +wild point 2. PRINCIPLE OF DIA - DIA Procedure Spectral Transform – Noise Immunity q = T2/T1 = 0.001 Spectral Plots • DIArecognizes the model withq = 0.001(CNLS recognizes the model up to q = 0.01); • DIArecognizes the model withq = 0.001up to 4 digits. The procedure of truncation increases only the number of low intensity “fuzzy” lines in the vicinity of the 2 spectral peaks; • The introduction of a“wild point” does not influence the selectivity of DIA,because its presence only gives additional “fuzzy line” located far away from the 2 basic peaks.
IEES-BAS Centre of Excellence • mixing of two neighbouring phenomena • presence of frequency dispersion (CPE, W etc). or The regions of mixing cannot produce spectral peaks. They form ”tails” in the spectral plots. C R C CPE R R CPE 3. SECONDARY DIA -Introduction When the LOM does not correspond to the object’s structure, frequencydependence is observed in the temporal plots. It may be due to:
IEES-BAS Centre of Excellence 3. SECONDARY DIA -Introduction Although introduced to the identification of models with lumped elements, the applied LOM can be used for the recognition of frequency distribution. This property increases the analytical power of the DIA since it ensures structural and parametric identification within a wider frequency range, including regions where the LOM does not correspond to the structure of the investigated object. Thus DIA can be applied for investigation of a wide variety of real samples, containing rough and inhomogeneous surfaces or inhomogeneous volume properties. The identification of models with frequency dispersion behaviour is based on the so-called Secondary Differential Impedance Analysis.
IEES-BAS Centre of Excellence The Secondary DIA is performed by differentiation of the logarithmic LOM parameters’ estimates with respect to the logarithm of the frequency. It presents their frequency dependence in the form: where j denotes the corresponding LOM’s parameter estimate or . Thus a new set of functions is obtained, which forms a new estimated data set : Since the Secondary Analysis describes the differentiation of the temporal functions, it is called Differential Temporal Analysis. (12) (13) 3. SECONDARY DIA Differential Temporal Analysis
IEES-BAS Centre of Excellence The derivatives of the parameters’ estimatesbecome equal to 0 in the frequency range where the LOM corresponds to the nature of the impedance object, i.efor a model of a simple Faradaic reaction as well as for the plateaus of a lumped (homogeneous) model involving one or more adsorbed species R1 R3 R2 The two frequency bands, where is equal to 0 are separated by a bell-shaped region of transition, which corresponds to the mixing of the two time-constant type sub-models. C1 C2 3. SECONDARY DIA Differential Temporal Analysis Secondary DIA for the “lumped parts of a model” (14)
IEES-BAS Centre of Excellence Secondary DIA for the “lumped parts of a model” The Differential Spectral Analysisrepresents the results obtained by the differential temporal analysis in a spectral form. The spectral transform procedure follows that introduced in the spectral transform of the temporal functions. In this case, however, . The set of differential spectra in a position 0 focuses on the presence of time-constant sub-models. R1 R3 R2 The appearance of additional “fuzzy lines” which form small spectral“tails”next to the main pure reaction peak at visualizes the mixing of two uniform sub-models. C1 C2 3. SECONDARY DIA Differential Spectral Analysis
IEES-BAS Centre of Excellence The irregular electrode surface, due to surface roughness or non-uniformly distributed properties, leads to a dispersion of the parameters. Very often this behaviour is successfully approximated by an empirical relationship, known as constant phase element (CPE). CPE Impedance (15) Temporal plot The dispersion is described by straight lines, i.e. it has a constant slope. 3. SECONDARY DIA Recognition of CPE Dispersion When the dispersion curve in the temporal plot has a constant slope, the -functions also acquire a constant value, different from 0, which is characteristic of this dispersion. In such cases the Secondary DIA is obligatory, since it can identify the dispersion zone in a more explicit way.
IEES-BAS Centre of Excellence The derivatives of equations (16) – (18) form a new set of interdependent “δ” functionswith definite for the CPE behaviour, determined by the constant slope of the dispersion curves in the temporal plot: (20) 3. SECONDARY DIA Recognition of CPE Dispersion The secondary frequency analysis in the case of CPE operates with the projection of the CPE impedance in the internal LOM’s space, represented in coordinates R, CandT: lgR = r= -lg A + lg [cos(pn/2)] – n lgω(16) lgC =c = lgA – lg[sin(πn/2) – (1 – n)lgω(17) lgT=τ=-lgw – lg [tg(pn/2) (18) lgA= -lgR + lg[cos(pn/2)] – n lg w = lg C + lg[(pn/2)] + (1-n) lg w(19)
IEES-BAS Centre of Excellence Differential Temporal Plot 0,3 0,7 1 Differential Spectral Plot The combined differential spectral plot of , and , which is characterized by three distinct spectralpeaks, can be regarded as a “fingerprint” of the CPE behaviour. 3. SECONDARY DIA Example for Recognition of CPE Dispersion
IEES-BAS Centre of Excellence 3. SECONDARY DIA TEST Example: Find the value of the CPE coefficient using the given Differential plots (click on the correct value) Differential Temporal Plot Differential Spectral Plot The CPE coefficient is: 00.100.20 0.300.400.50 0.550.600.70 0.800.901
IEES-BAS Centre of Excellence Randles model (RND)is widely applied to electrochemical systems for modelling of a simple Faradaic reaction with a mass transport towards the electrode’s surface, limited by a linear semi-infinite diffusion. R1 R2 R1 R2 BW C The deviations from Fick’s law can be presented by modification of the Warburg impedance with CPE. The model is known as Modified Randles Model(MRND). W C CPE 3. SECONDARY DIA Recognition of Randles Model The application of the Secondary Differential Analysispromotes the capability of the DIA for model recognition. It can be applied to the identification of electrochemical elements or more complicated models with CPE in their structure. This section introduces some examples for the application of the DIA on synthetic models often used in electrochemical systems .
IEES-BAS Centre of Excellence Temporal Analysis The applied estimatesdata set is: (21) RND MRND 3. SECONDARY DIA Recognition of Randles Model DIA Results: The temporal analysis discovers three segments with differing frequency behaviour. The high frequency region Iis frequency invariant. The low frequency parts II and III, however, show two types of frequency dispersion, which require a Secondary DIA. The lack of frequency dispersion in segment Iconfirms the correspondence between the LOM and the object in this region, i.e. the recognized structure is a parallel connection between Rct (R) andCdl (C).
IEES-BAS Centre of Excellence MRND RND 3. SECONDARY DIA Recognition of Randles Model DIA Results: Temporal Analysis - Spectral presentation The spectral plots sharply distinguish too types of behaviour – frequency independent, which is represented by a well defined spectral line, and frequency dependent, which forms a spectral “tail”. This result demonstrates the high sensitivity of the spectral analysis for the identification of time-constants. Theplateaus in the temporal plots and the spectral images ensure the parametric identification of theRct/Cdlsub-model.
IEES-BAS Centre of Excellence Secondary DIA - Differential Temporal Analysis The Secondary DIAidentifies the model in the regions of frequency dispersion (segments II and III) in the temporal plots. It operates with the estimates data set (21): The Differential Temeporal Analysis separates well three segments and ensures the information needed for their structural identification. MRND RND 3. SECONDARY DIA Recognition of Randles Model DIA Results:
IEES-BAS Centre of Excellence Segment I: The dependencies obtained for segment I confirm the structure of resistance and capacitance in parallel, since Segment II For RND the obtained dependencies recognize Warburg Impedance, since For MRND the obtained dependencies recognize CPE (n = 0.4), since 3. SECONDARY DIA Recognition of Randles Model Secondary DIA - Differential Temporal Analysis Segment III: The bell-shaped region III defines the region of mixing between the two sub-models in the Randles structure.
IEES-BAS Centre of Excellence 3. SECONDARY DIA Recognition of Randles Model • Secondary DIA - Differential Spectral Analysis • The combined Differential Spectral Plot( see page 46)represents in an explicit way the structural and parametric identification, emphasizing the two kernels of that structure . • The spectral lines inzero position (segment I) manifest the presence of the time-constant sub-model, corresponding to the Faradaic reaction. • The combination of the other three spectral peaks (segment II) visualizes the transport limitation: • For values 0.5, 0.5 and 1 - Warburg impedance (RND); • For values 0.3, 0.7, 1 - CPE (MRND).
IEES-BAS Centre of Excellence R1 R2 R1 R2 BW C W C CPE 3. SECONDARY DIA Recognition of Randles Model Secondary DIA - Differential Spectral Analysis
IEES-BAS Centre of Excellence R1 CPE R2 3. SECONDARY DIA Recognition of Simple Faradaic Reaction with Capacitive CPE The impedance diagram of a modified time-constant model with a capacitive CPE is characterized bydepressed semicircle, which is often observed in real systems. In electrochemical systems this structure is known as modified polarizable electrode.
IEES-BAS Centre of Excellence Temporal Analysis The applied estimatesdata set is: The behaviour of the temporal plots is surprising to some extent, since the dispersion concerns not only cand τ, but also rwithin the whole frequency range. Formally the temporal plots can be divided into a high frequency segment I and a low frequency segment II . 3. SECONDARY DIA Recognition of Simple Faradaic Reaction with Capacitive CPE DIA Results: Temporal plot
IEES-BAS Centre of Excellence Temporal plot Spectral plot 3. SECONDARY DIA Recognition of Simple Faradaic Reaction with Capacitive CPE DIA Results: Temporal Analysis In the r – temporal plot the two segments (I and II) can be regarded as separated by a region of pseudo-mixing (segment III), which has a shape close to a plateau andcreates the small intensity spectral peak in the spectral plots. It also determines the approximation to the estimate of the model’s resistance R (Rct), i.e. the temporal analysis of segment III in the temporal plot ensures its parametric identification.
IEES-BAS Centre of Excellence Secondary DIA The Secondary DIAidentifies the model in the frequency dispersion regions (segments I and II) in the temporal plots. It operates with the estimates data set (21): The Differential Temeporal Analysis of Segment I distinguishes dependencies of CPE-type, which ensure identification of the CPE exponent n (n = 0.8). Knowingn, the parameter A can be also calculated. (22) Differential Temporal Plot Differential Spectral Plot 3. SECONDARY DIA Recognition of Simple Faradaic Reaction with Capacitive CPE