Valgrind: Powerful Memory Debugging Tool
120 likes | 177 Views
Valgrind is a comprehensive tool suite for debugging and profiling in C/C++ programs, with features like detecting memory leaks and uninitialized memory usage. Learn how to use Valgrind effectively to enhance program performance and security.

Valgrind: Powerful Memory Debugging Tool
E N D
Presentation Transcript
CSCE-221Valgrind Emil Thomas 02/28/19
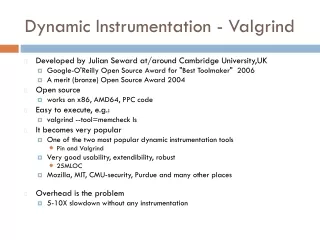
What is Valgrind • Is a tool suite that contains various debugging and profiling tools • Most popular tool : Memcheck – Can detect many Heap memory related errors • Used with C/C++ programs for finding Memory Mismanagement • Available in Linux
Features of Valgrind • Can detect the use of uninitialized memory in Heap • Reading/writing memory after it has been deallocated using delete • Memory leaks -- where pointers to new'd blocks are lost forever • Mismatched use of new/new [] vs delete/delete []
Limitations of Valgrind • Occasionally can have false positives • Cannot detect out-of-range read/write on Stack allocated arrays
Why should we Check Memory leak? • Performance Tuning • Prevent run time Errors • Can help fixing segmentation fault errors • Saves hours of debugging • Can increase the security of application
Invoking valgrind (Command line) • The C++ program must be compiled with debugging info (-g flag) • g++ -std=c++11 –g Driver.cpp –o driver.out • valgrind ./driver.out
Avoiding Memory Leak • Every new allocated objects (Objects in Heap) should have a matching delete • Person *Frank = new Person(); ……. delete Frank; • int *ptr = new int [50]; ……. delete [] ptr; • Should not need to call delete on stack allocated objects int main() { Person Foo; }
Exercise to be uploaded to ecampus && Do Survey !!! • Login to linux2.cs.tamu.edu or compute.cs.tamu.edu using your netid and password • Go to your csce221 folder • cd csce221 • Copy the cpp file • wget http://faculty.cse.tamu.edu/slupoli/notes/DataStructures/labs/Valgrind/fixMem.cpp • Compile and run the code • g++ -std=c++11 –g fixMem.cpp –o driver.out • ./driver.out • Run Valgrind • valgrind ./driver.out • Change the code to fix any memory related errors (i.evalgrind output should be clean) • Upload the fixed cpp file in ecampus under lab7_valgrind
References: • http://valgrind.org/ • http://valgrind.org/docs/manual/valgrind_manual.pdf real_time • Notes from Prof. Lupoli • http://cs.ecs.baylor.edu/~donahoo/tools/valgrind/
