Download
1 / 18
180 likes | 286 Views
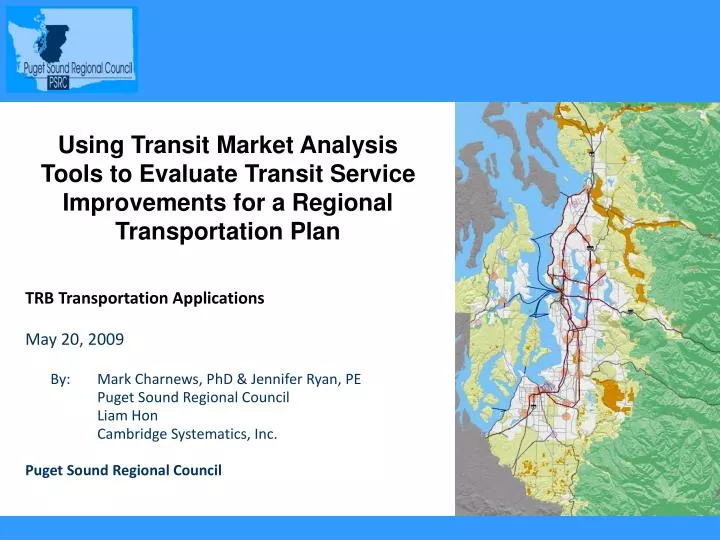
Using Transit Market Analysis Tools to Evaluate Transit Service Improvements for a Regional Transportation Plan. TRB Transportation Applications May 20, 2009 By: Mark Charnews, PhD & Jennifer Ryan, PE Puget Sound Regional Council Liam Hon

E N D
Using Transit Market Analysis Tools to Evaluate Transit Service Improvements for a Regional Transportation Plan TRB Transportation Applications May 20, 2009 By: Mark Charnews, PhD & Jennifer Ryan, PE Puget Sound Regional Council Liam Hon Cambridge Systematics, Inc. Puget Sound Regional Council
PSRC Integrated Urban Models Integrated Models Simulating Persons and Vehicles at a Parcel Level PSEF Geodatabase Regional Economic Forecasts Transport System Alternatives Development Projects TOM IDAS TCI/SPT UrbanSim Hybrid Activity Travel Forecasts Land Use Forecasts EPA MOVES BCA Air Quality Analysis Benefit-Cost Analysis
T2040 Alternatives Development Tools Regional Customization of Various Modeling Tools: • Market Segmentation Attitudinal preference analysis from 2006 Household Survey. • Transit Competitive Index Demand based automated process to combine Census and Employment block data with results of market segmentation to identify most transit competitive O-D pairs within a corridor. • Sketch Planning Tool – Market Analysis Supply based automated process to evaluate changes in ridership within a corridor’s O-D pairings based on travel time changes for all routes.
Attitudinal Factorsfrom 2006 PSRC Household Survey Travel Stress Transit Receptiveness Comfort and Time Use Environmental Consciousness Need for Travel Flexibility Time Sensitivity
Market Segmentation All Travelers in the Puget Sound Region Transit Receptive High Transit Receptiveness Medium Transit Receptiveness Low Transit Receptiveness Need for Travel Flexibility High Need for Flexibility Low Need for Flexibility Medium Need For Flexibility Low Need For Flexibility High Need for Flexibility High Comfort Time Use Low Comfort Time Use Medium Comfort Time Use High Comfort Time Use Medium Comfort Time Use Low Comfort Time Use Medium Comfort Time Use Low Comfort Time Use Comfort and Time Use No Frills 9 To 5’ers Mobile Riders Comfortable Movers Multi-trip Drivers Productive Riders Routine Riders Easy Goers Market Segment Comfortable Drivers
Market Segment Size 22.7% 19.7% 14.1% 15.1% 8% 5.2% 6.2% 8.9% 6% 30% 6% 12% 10% 4% 34% 30% 0% 0% 12% 10% 22% Transit Percentage 20% 18% 16% 14% 12% 10% Percent Incidence 8% 6% 4% 2% 0% 0% 0% Productive Mobile Routine Comfortable Easy Goers No Frills 9 To 5ers Multi-trip Comfortable Riders Riders Riders Movers Drivers Drivers
Interpreting the Transit Competitiveness Index (TCI) TCI Production Trip Density Attraction Trip Density 0 1-50 50-100 100-200 Market Segment Concentration Parking Cost 200-500 500-2,000 >2,000 Household Income Congestion Trip Purposes • TCI shows how competitive transit is relative to auto • TCI utilizes road network not transit availability • TCI > 100 is transit competitive • TCI is proportional to the TAZ’s ability to generate transit trips Transit competitive TCI
Work Trips to Bellevue • TCI Results: • Bellevue/Redmond corridor very strong work attractor on Eastside • Surprisingly strong attraction from North and West Seattle (limited thru bus connections currently) Redmond/ Microsoft Bellevue
Transit Sketch Planning Tool destination origin • Applies results of market research • Stores existing mode shares • Matches markets with transit service • Segments markets geographically • Inputs service scenarios • Outputs ridership New direct service bus ridership: +100 dailydrive alone: -100 daily Existing service
Use of Level of Service Parameters Examples of Transit Service impacts on Level of Service Parameters: • Bus Rapid Transit – decrease in-vehicle time, increase walk distance both peak and offpeak • Transit Signal Priority – decrease in-vehicle time • Stop Consolidation – increase walk time, decrease in-vehicle time • Fare Change – change travel cost by transit • Auto Congestion – increase in-vehicle time auto • Direct Transit Service – decrease transfers, decrease in-vehicle time
TCI and SPT Applications • Used for Transportation 2040 Long Range Plan Update • Used to develop ridership estimates for BNSF Commuter Rail Feasibility Study • Will be used to develop transit service for Bellevue Multimodal Concurrency Study
Questions For more information, contact: Mark Charnews, PhD Senior Modeler Puget Sound Regional Council mcharnews@psrc.org 206-971-3285 Jennifer Ryan, PE Principal Planner jryan@psrc.org 206-405-0542 Liam Hon Associate Cambridge Systematics, Inc. lhon@camsys.com 206-327-9962