Download
1 / 9
90 likes | 216 Views
Example 9.12 Sample Size Selection for Estimating Reaction to New Sandwich. Controlling Confidence Interval Length. Objective. To find the sample size of customers required to achieve a sufficiently narrow confidence for the mean rating of the new sandwich. Background Information.

E N D
Example 9.12Sample Size Selection for Estimating Reaction to New Sandwich Controlling Confidence Interval Length
Objective To find the sample size of customers required to achieve a sufficiently narrow confidence for the mean rating of the new sandwich.
Background Information • The fast-food manager in Example 9.2 surveyed 40 customers, each of whom rated a new sandwich on a scale of 1 to 10. • Based on the data, a 95% confidence interval for the mean rating of all potential customers extended from 5.739 to 6.761, for a half-length of (6.761-5.379)/2 = 0.511. • How large a sample would be needed to reduce this half-length to approximately 0.3?
Confidence Intervals • Confidence intervals are a function of three things: • the data in the sample • We have control over the data by using the various random sampling plans to reduce variability. • An area of statistics called experimental design suggests how to perform experiments to obtain the most information from a given amount of sample data. • the confidence level • This effect is clear as the confidence level increases, the length of the confidence interval increases as well. • the sample size(s) • The most obvious way to control confidence interval length is to choose the size of the sample appropriately.
Sample Size • Sample size selection must be done before a sample is observed. • Sample size estimation formula:
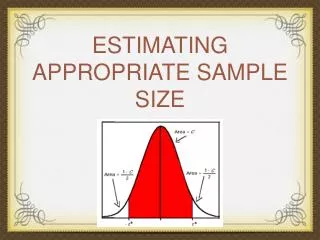
Calculations • The formula for n uses three inputs: • the z multiple, which is 1.96 for a 95% confidence level; • the prescribed confidence interval half-length B, which is 0.3; • and an estimate sigmaest of the standard deviation • The final input must be guessed, but for this example with a sample size 40 we can use the observed sample standard deviation of 1.597 (which can be determined with the STDEV function).
Calculations -- continued • The formula yields a rounded result of n = 109. • The claim, then is that the manager surveys 109 customers with a 95% confidence interval will have the approximate half length of 0.3.
Calculations -- continued • The same calculations can be done using the Sample Size Selection procedure of Excel’s StatPro add-in. • Just select the menu item and select the parameter to analyze and enter the requested values. • A message telling you the required sample size is displayed.
Question • What if the manager was at the planning stage and didn’t have a “preliminary” sample of size 40? What standard deviation estimate should she use for est ? • The manager basically has three choices: • she can base her estimate of the standard deviation on historical data assuming that relevant historical data are available, • she can take a small preliminary sample (of size 20, say) just to get an estimate of the standard deviation, • she can simply guess a value for the standard deviation. • not recommended but there are some cases where it is the only feasible option.