Download

1 / 32
370 likes | 935 Views
Understand how to calculate the required number of study subjects in research to detect statistically significant effects, with formulas and examples for precision and power considerations. Learn about hypothesis testing, clinical effect size, and statistical reasoning.

E N D
How many study subjects are required ? (Estimation of Sample size)ByDr.ShaikShaffiAhamedAssociate ProfessorDept. of Family & Community MedicineCollege of MedicineKing Saud University
SAMPLE SIZE: How many subjects are needed to assure a given probability of detecting a statistically significant effect of a given magnitude if one truly exists? • POWER: If a limited pool of subjects is available, what is the likelihood of finding a statistically significant effect of a given magnitude if one truly exists?
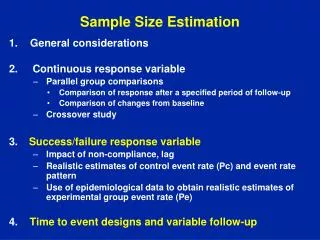
Before We Can Determine Sample Size We Need To Answer The Following: 1. What is the main purpose of the study? 2. What is the primary outcome measure? Is it a continuous or dichotomous outcome? 3. How will the data be analyzed to detect a group difference? 4. How small a difference is clinically important to detect?
5. How much variability is in our population? 6. What is the desired and ? 7. What is the anticipated drop out and non-response % ?
Where do we get this knowledge? • Previous published studies • Pilot studies • If information is lacking, there is no good way to calculate the sample size
Scenario 2 Power Scenario 1 Precision All studies Hypothesis testing Descriptive Sample surveys Simple - 2 groups Complex studies
SAMPLE SIZE FOR ADEQUATE PRECISION • In a descriptive study, • Summary statistics (mean, proportion) • Reliability (or) precision • By giving “confidence interval” • Wider the C.I – sample statistic is not reliable and it may not give an accurate estimate of the true value of the population parameter
Sample size formulae for reporting precision For single mean : n = Z2α S2 /d2 where S=sd (s ) For a single proportion : n = Z2αP(1-P)/d2 Where , Zα =1.96 for 95% confidence level Zα = 2.58 for 99% confidence level
Problem 1 (Single mean) A study is to be performed to determine a certain parameter in a community. From a previous study a sd of 46 was obtained. If a sample error of up to 4 is to be accepted. How many subjects should be included in this study at 99% level of confidence?
Answer n = (Za/2)2s2 / d2 s: standard deviation = 46 d: the accuracy of estimate (how close to the true mean)= given sample error =4 Za/2: A Normal deviate reflects the type I error. For 99% the critical value =2.58
Problem 2 (Single proportion) It was desired to estimate proportion of anemic children in a certain preparatory school. In a similar study at another school a proportion of 30 % was detected. Compute the minimal sample size required at a confidence limit of 95% and accepting a difference of up to 4% of the true population.
Answer n = (Za/2)2p(1-p) / d2 p: proportion to be estimated = 30% (0.30) d: the accuracy of estimate (how close to the true proportion) = 4% (0.04) Za/2: A Normal deviate reflects the type I error For 95% the critical value =1.96
Scenario 2 Power Scenario 1 Precision All studies Hypothesis testing Descriptive Sample surveys Simple - 2 groups Complex studies
Scenario 2 Three bits of information required to determine the sample size Type I & II errors Variation Clinical effect
Type I error: Rejecting H0 when H0 is true • : The type I error rate. • Type II error: Failing to reject H0 when H0 is false • : The type II error rate • Power (1 - ): Probability of detecting group difference,given the size of the effect () and the sample size of the trial (N)
Diagnosis and statistical reasoning Disease status Present Absent Test result +ve True +ve False +ve (sensitivity) -ve False –ve True -ve (Specificity) Significance Difference is Present Absent (Ho not true) (Ho is true) Test result Reject Ho No error Type I err. 1-b a Accept Ho Type II err. No error b 1-a a : significance level 1-b : power
Clinical Effect Size “What is a meaningful difference between the groups” • It is truly an estimate and often the most challenging aspect of sample size planning • Large difference – small sample size • Small differences – large sample size • Cost/benefit
Variation Variability All statistical tests are based on the following ratio: Difference between parameters Test Statistic = v /n As n v/n Test statistic
Sample size formulae For two means : n =2S2 (Zα+Zβ)2 /d2 where S=sd For two proportions : Zα= 1.96 for 95% confidence level Zα = 2.58 for 99% confidence level ; Zβ= 0.842 for 80% power Zβ= 1.282 for 90% power
Example 1: Does the ingestion of large doses of vitamin A in tablet form prevent breast cancer? • Suppose we know from our tumor-registry data that incidence rate of breast cancer over a 1-year period for women aged 45 – 49 is 150 cases per 100,000 • Women randomized to Vitamin A vs. placebo
Example 1 continued • Group 1: Control group given placebo pills. Expected to have same disease rate as registry (150 cases per 100,000) • Group 2: Intervention group given vitamin A tablets. Expected to have 20% reduction in risk (120 cases per 100,000) • Want to compare incidence of breast cancer over 1-year • Planned statistical analysis: Chi-square test to compare two proportions from independent samples H0: p1 = p2 vs. HA: p1 p2
Sample Size Formula To Compare Two Proportions From Independent Samples: H0: p1=p2 1. level 2. level (1 – power) 3. Expected population proportions (p1, p2)
Example 1: Does ingestion of large doses of vitamin A prevent breast cancer? • Test H0: p1 = p2 vs. HA p1 p2 • Assume 2-sided test with =0.05 and 80% power • p1 = 150 per 100,000 = .0015 • p2 = 120 per 100,000 = .0012 (20% rate reduction) • = p1 – p2 = .0003 • z1-/2 = 1.96 z1- = .84 • n per group = 234,882 • Too many to recruit in one year!
Example 2: Does a special diet help to reduce cholesterol levels? • Suppose an investigator wishes to determine sample size to detect a 10 mg/dl difference in cholesterol level in a diet intervention group compared to a control (no diet) group • Subjects with baseline total cholesterol of at least 300 mg/dl randomized
Example 2 continued • Group 1: A six week diet intervention • Group 2: No changes in diet • Investigator wants to compare total cholesterol at the end of the six week study • Planned statistical analysis: two sample t-test (for independent samples)(comparison of two means) H0: 1 = 2 vs. HA: 12
Sample Size Formula To Compare Two Means From Independent Samples: H0: 1 = 2 1. level 2. level (1 – power) 3. Expected population difference (= |1 - 2|) 4. Expected population standard deviation (1 , 2)
Continuous Outcome (2 Independent Samples) • Test H0: 1 = 2 vs. HA: 12 • Two-sided alternative and equal allocation • Assume outcome normally distributed with:
Example 2: Does a special diet help to reduce cholesterol levels? • Test H0: 1=2 vs. HA : 12 • Assume 2-sided test with =0.05 and 90% power • = 1 - 2 = 10 mg/dl • 1= 2 = (50 mg/dl) • z1-/2 = 1.96 z1- = 1.28 • n per group = 525 • Suppose 10% loss to follow-up expected, adjust n = 525 / 0.9 = 584 per group
Example 3 • A study is to be done to determine effect of 2 drugs (A and B) on blood glucose level. From previous studies using those drugs, Sd of BGL of 8 and 12 g/dl were obtained respectively. • A significant level of 95% and a power of 90% is required to detect a mean difference between the two groups of 3 g/dl. How many subjects should be include in each group?
Answer (SD1 + SD2)² n = -------------------- * f(α,β) ∆²
The following steps constitute a pragmatic approach to decision taking on Sample size: (1) Remember that there is no stock answer. (2) Initiate early dialogue with an applied statistician. (3) Discuss your assumptions with the statistician– consider various possibilities. (4) Examine feed back from the statisticians. (5) Consider other factors also– eg., availability of cases, cost, time. (6) Make a balanced choice (7) Ask if this number gives you a reasonable prospect of coming to useful conclusion. (8) If yes, proceed if no, reformulate your problem for study.
To conclude, • Define research question well • Consider study design, type of response variable, and type of data analysis • Decide on the type of difference or change you want to detect (make sure it answers your research question) • Choose and • Use appropriate equation for sample size calculation or sample size tables/ nomogram or software.