Download
1 / 48
480 likes | 609 Views
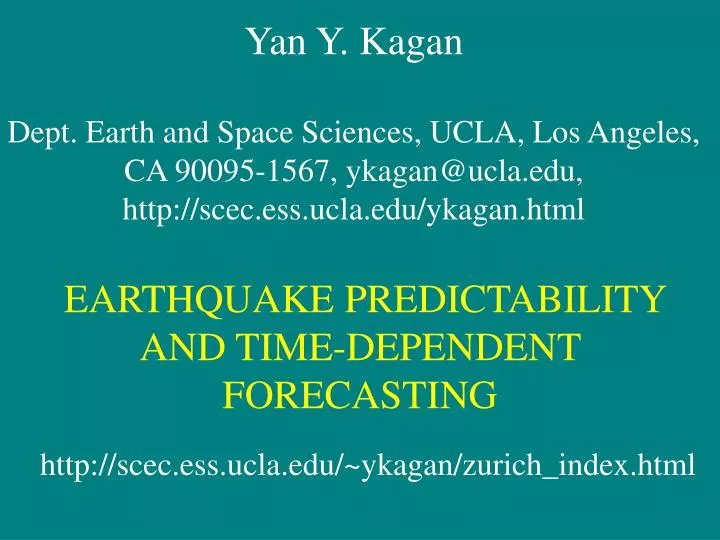
Yan Y. Kagan Dept. Earth and Space Sciences, UCLA, Los Angeles, CA 90095-1567, ykagan@ucla.edu, http://scec.ess.ucla.edu/ykagan.html. EARTHQUAKE PREDICTABILITY AND TIME-DEPENDENT FORECASTING. http://scec.ess.ucla.edu/~ykagan/zurich_index.html. (1). (1) Frequency-moment distribution.

E N D
Yan Y. Kagan Dept. Earth and Space Sciences, UCLA, Los Angeles, CA 90095-1567, ykagan@ucla.edu, http://scec.ess.ucla.edu/ykagan.html EARTHQUAKE PREDICTABILITY AND TIME-DEPENDENT FORECASTING http://scec.ess.ucla.edu/~ykagan/zurich_index.html
(1) Frequency-moment distribution Kagan, Y. Y., 1997. Seismic moment-frequency relation for shallow earthquakes: Regional comparison, J. Geophys. Res., 102, 2835-2852. Kagan, Y. Y., 2002. Seismic moment distribution revisited: I. Statistical results, Geophys. J. Int., 148, 521-542. Bird, P., and Y. Y. Kagan, 2004. Plate-Tectonic Analysis of Shallow Seismicity: Apparent Boundary Width, Beta, Corner Magnitude, Coupled Lithosphere Thickness, and Coupling in Seven Tectonic Settings, Bull. Seismol. Soc. Amer., 94(6), 2380-2399 (plus electronic supplement).
Review of results on spectral slope, b: Although there are variations, none is significant with 95%-confidence. Kagan’s [1999] hypothesis of uniform b still stands.
Long-term forecast: 1977-today Spatial smoothing kernel is optimized by using the first part of a catalog to forecast its second part.
Cumulative event curve interpreted here as cumulative seismic moment for a realization of the branching process model with an illustration of the filtered signal (using the theoretical seismogram in the middle) from which events and their seismic moments can be determined (Kagan and Knopoff, JGR, 1981).
Kagan, Y. Y., and Knopoff, L., 1984. A stochastic model of earthquake occurrence, Proc. 8-th Int. Conf. Earthq. Eng., 1, 295-302.
(3) Stochastic models of earthquake occurrence and forecasting • Long-term models for earthquake occurrence, optimization of smoothing procedure and its testing (Kagan and Jackson, 1994, 2000). • Empirical branching models (Kagan, 1973a,b; Kagan and Knopoff, 1987; Ogata, 1988, 1998; Kagan, 2006). • Physical branching models – propagation of earthquake fault is simulated (Kagan and Knopoff, 1981; Kagan, 1982).
(a) Earthquake catalog data (b) Point process: Branching along magnitude axis, introduced by Kagan (1973a;b) (c) Point process: Branching along time axis (Hawkes, 1971; Kagan & Knopoff, 1987; Ogata, 1988)
Time history of long-term and hybrid (short-term plus 0.8 * long-term) forecast for a point at latitude 39.47 N., 143.54 E. northwest of Honshu Island, Japan. Blue line is the long-term forecast; red line is the hybrid forecast.
Short-term forecast uses Omori's law to extrapolate present seismicity. Forecast one day before the recent M8.3 Kuril Islands earthquake.
Short-term forecast uses Omori's law to extrapolate current seismicity. Red spot east of the Kuril Islands is the consequence of two M>8 2006/2007 earthquakes.
(4) Forecast Efficiency Evaluation • We simulate synthetic catalogs using smoothed seismicity map. • Likelihood function for simulated catalogs and for real earthquakes in the time period of forecast is computed. • If the `real earthquakes’ likelihood value is within 2.5—97.5% of synthetic distribution, the forecast is considered successful. Kagan, Y. Y., and D. D. Jackson, 2000. Probabilistic forecasting of earthquakes, Geophys. J. Int., 143, 438-453.
Here we demonstrate forecast effectiveness: displayed earthquakes occurred after smoothed seismicity forecast had been calculated.
Kossobokov, 2006. Testing earthquake prediction methods: ``The West Pacific short-term forecast of earthquakes with magnitude MwHRV \ge 5.8", Tectonophysics, 413(1-2), 25-31. See also Kagan & Jackson, TECTO, 2006, pp. 33-38.
(5) EARTHQUAKE PREDICTABILITY MEASUREMENT:INFORMATION SCORE AND ERROR DIAGRAM Two methods for measuring the effectiveness of earthquake prediction algorithms are discussed: the information score based on the likelihood ratio and error diagrams. For both of these methods, closed form expressions are obtained for the renewal process based on the gamma and lognormal distributions. The error diagram is more informative than the likelihood ratio and uniquely specifies the information score. We derive expressions connecting the information score and error diagrams. http://scec.ess.ucla.edu/~ykagan/eqpred_index.html
Basic equations Information score in bits: Calculation from likelihood ratio Calculation from error diagram Calculation of error diagram lower bound given info score
Molchan, G. M., and Y. Y. Kagan, 1992. Earthquake prediction and its optimization, J. Geophys. Res., 97, 4823-4838.
(6) Power-law distributions – new paradigms in statistics • Almost all statistical distributions in earthquake seismology are power-laws – Gutenberg-Richter relation, Omori’s law, the fractal pattern of earthquake spatial distribution. • These distributions are drastically different from Gaussian-type laws that were used in mathematical statistics for over two centuries.
Non-linear increase of sums of heavy-tailed distributions. .
Holt, W. E., Chamot-Rooke, N., Le Pichon, X., Haines, A. J., Shen-Tu, B., and Ren, J., 2000. Velocity field in Asia inferred from Quaternary fault slip rates and Global Positioning System observations, J. Geophys. Res., 105, 19,185-19,209.
(7) Application to insurance • The power-law distributions governing earthquake occurrence mean that very rare extreme events contribute a major part of total losses. • The theory of stable distributions needs to be applied for appropriate loss calculation.
Kagan, Y. Y., 1997. Earthquake size distribution and earthquake insurance, Communications in Statistics: Stochastic Models, 13(4), 775-797.