Download
1 / 69
690 likes | 849 Views
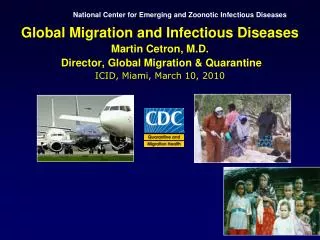
National Center for Emerging and Zoonotic Infectious Diseases. Global Migration and Infectious Diseases Martin Cetron, M.D. Director, Global Migration & Quarantine ICID, Miami, March 10, 2010. TM. Air travel – 24 hours. Historical perspective International migration patterns

E N D
National Center for Emerging and Zoonotic Infectious Diseases Global Migration and Infectious Diseases Martin Cetron, M.D. Director, Global Migration & Quarantine ICID, Miami, March 10, 2010 TM
Historical perspective International migration patterns GeoSentinel international migrant study U.S. Immigrant / Refugees Infectious Disease Concerns Tuberculosis Vaccine Preventable Diseases Neglected Tropical Diseases TM Brief Outline
TM Speed of Global Travel in Relation to World Population Growth From: Murphy and Nathanson Sems. Virol. 5, 87, 1994
With 1 billion people crossing international borders each year, there is no where in the world from which we are remote and no one from whom we are disconnected.
Migrating Populations, 1960-1975 Courtesy Dr. Martin Cetron, NCPDCID
Cholera in New York City, 1892 Source “Quarantine” by Howard Markal
TM Typhus Fever Epidemic, 1892 Source “Quarantine” by Howard Markal
“Quarantine” = Torture, exile, and death Death in a sailor’s uniform holding the yellow quarantine flag knocking on the door of NYC during the 1898 yellow fever epidemic Frank Leslie’s Illustrated Newspaper, Sept. 1878
Human Migration • “… the dynamic undertow of population change; everyone’s solution, everyone’s conflict.” • Michael Parfit National Geographic, October 1998 Congolese refugees arriving on shore of Lake Tanganyika, 1998 Photo by Karen Kasmauski
Refugees, IDPs, Immigrants, Temporary Migrants- 1990’s Making Tracks: Migration 1990’s
Globalization of migration (># countries involved) Acceleration of migration (rapid #s growth) Differentiation of migration (labor, refugee, etc.) Feminization of migration (labor migrants F>M) Politicization of migration (global governance) Proliferation of migration transition (emigration countries -> immigration countries, bi-directional) Intl. Migrants 1960-2005 6 Unique Patterns
Millions of International Migrants by Region, 1960-2000 Source: UNDESA, 2005 from Castles and Miller “Age of Migration” 4th Ed. 2009 * UN defines “migrants” as persons living outside their country of birth for >= 12 mos.
Trends in International *Migrants, by Region, 1960-2005 Migrants in millions Source: UNDESA, 2005 from Castles and Miller “Age of Migration” 4th Ed. 2009 * UN defines “migrants” as persons living outside their country of birth for >= 12 mos.
International *Migrants by Region, 2005 Total=191million (~3% World’s Pop.) Source: UNDESA, 2005 from Castles and Miller “Age of Migration” 4th Ed. 2009 * UN defines “migrants” as persons living outside their country of birth for >= 12 mos.
International *Migrants (N=191million), by Development Status, 2005 115 M 75 M Source: UNDESA, 2005 from Castles and Miller “Age of Migration” 4th Ed. 2009 * UN defines “migrants” as persons living outside their country of birth for >= 12 mos.
Leading Causes of Death Worldwide About 15 million (>25%) of 57 million annual deaths worldwide are the direct result of infectious disease. Figures published by the World Health Organization (see http://www.who.int/whr/en). From ‘The Challenge of Emerging amd Re-emerging Infectious Diseases.” David M. Morens, Gregory K. Folkers& Anthony S. Fauci. Nature 430, 242-249(8 July 2004)
Resp Infxn HIV/AIDS Diarrhea Deaths, millions TB Malaria Measles
The New Global Health NCPDCID Academia Private foundations Other governments CIDA US Government International organizations
The Global Surveillance Network of the ISTM and CDC A worldwide communications and data collection network of travel/tropical medicine clinics www.geosentinel.org
Provider-based Surveillance of international travelers and migrants. • Does not cover endemic diseases in local populations • 48 travel/tropical medicine clinics globally (since 1996) • & 185 Network Members on all 6 continents (since 2002) What is ?
Who are GeoSentinel patients?(as of Dec 2009) Complete Database(n= 114,861) After Travel Visits Only(n= 59,477)
Number of Foreign-Born Persons Living in the U.S., 1900-2000 Millions of Foreign-born Persons Source: Center for Immigration Studies, 2001
Immigrants: Percent of U.S. Population, 1900-2000 *Camarota SA January 2001. Center for Immigration Studies
Estimated Annual International Arrivals U.S.A. Refugees 70 – 90,000 Immigrants >1,000,000 International Travelers Foreign 60M / U.S. 60M *Presidential request for refugee admissions: 70,000 refugees Source: U.S. Department of Homeland Security
Immigrant - Top 5 Mexico Philippines China India DR Refugee - Top 5 Somalia Russia Cuba Vietnam Iran
U.S. Immigrants Admitted by Region of Birth, 1999-2008 DHS Yearbook of Immigration Statistics 2008
U.S. Immigrants Country of Birth, Admissions FY 2008 DHS Yearbook of Immigration Statistics, 2008
Estimated TB Incidence Rate, 2007 Estimated new TB cases (all forms) per 100 000 population No estimate 0-24 25-49 50-99 100-299 300 or more 1/3 of world infected 9.3 million cases of active TB 1.8 million deaths
TB Cases, United States, 1993-2008 Overall TB rate: 4.2 per 100,000 FB 20.6/100K US 2.1/100K
MDR TB Cases, United States 1993-2007 XDR TB (’00-’06): 76% XDR TB (’00-’06): 76%
Overseas TB Screening:1991 TB screening algorithm Inactive TB (class B2 TB) Chest radiograph No TB Active TB AFB sputum smears (3) All (-) (at least one+) Smear-negative TB (class B1 TB) Smear-positive TB (class A TB)
TB Study in Vietnamese Immigrants Susan Maloney et. al. Arch Intern Med. 2006;166:234-240
Immigrants 2.7 M screen overseas 26K Active TB smear (-) B1 rate = 961/100K 23K Inactive Old TB B2 rate = 837/100K Refugees 279K screen oversea 3.9K Active smear (-) B1 rate = 1,036/100K 10.7K Inactive Old TB B2 rate = 2,838/100K U.S TB Dz diagnosis B1 f/u = 7% Pulm TB B2 f/u = 2% Pulm TB Prevalence of smear-negative & inactive TB in U.S.-bound Immigrants / Refugees, 1999-2005
2007 Revised TB Screening & Rx 2-14 years of age In high incidence countries: TST ≥15 years of age CXR CXR CXR suggestive of TB or HIV positive 3 sputum smears & cultures If culture positive Drug susceptibility testing DOT until completion of therapy
Global Spread of H1N1 • Surveillance of • Clusters • Closures • Community transmission • Changes in transmission • Changes in age distribution Slide courtesy of Dr. John Brownstein, HealthMap
Vaccination Requirement for Migrants to U.S. Most persons entering U.S. do not require vaccination ^New arrivals are entering from overseas, status adjusters are already in the US *Other vaccination requirements, eg school entry, may apply
Outbreaks of Vaccine-Preventable Diseases affecting U.S.-Bound Refugees
Measles in the United States, 2002-2005* *CDC, preliminary data
Refugee Resettlement, 2006 - Admitting Countries Others** Scandinavia* 3% 5% Canada 15% United States Australia 58% 19% * Sweden, Norway, Denmark, Finland ** Netherlands, UK, New Zealand, Ireland, Chile, Mexico