Download
1 / 1
10 likes | 154 Views
National Center for Emerging and Zoonotic Infectious Diseases. Division of Global Migration and Quarantine.

E N D
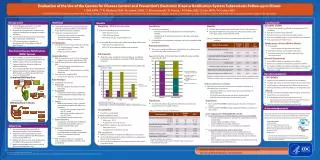
National Center for Emerging and Zoonotic Infectious Diseases Division of Global Migration and Quarantine Evaluation of the Use of the Centers for Disease Control and Prevention’s Electronic Disease Notification System Tuberculosis Follow-up in IllinoisT. Bell, MPH ,a,b N. Molinari, PhDa, M. Selent, DVM, a S. Blumensaadt, c B. Puesta, c R. Philen, MD, a D. Lee, MPH, a N. Cohen, MDaa Centers for Disease Control and Prevention, Atlanta, Georgia, United States, b Council of State and Territorial Epidemiologists, Atlanta, Georgia, United States c Centers for Disease Control and Prevention, Chicago Quarantine Station, Chicago, Illinois • Background • Conclusions • Methods • Results • Strengths of EDN • 60% of TB cases reported in U.S. in 2010 occurred in foreign-born persons • All applicants for permanent residency and refugees complete pre-immigration medical evaluation • Some inactive TB overseas found to be active after entering the United States • CDCrecommends re-evaluation of immigrants with TB conditions within 30 days of arrival • Simplicity – EDN User Interviews • Stability • Sensitivity • Use of EDN in Illinois was evaluated using the 2001CDC Updated Guidelines for Evaluating Public Health Surveillance Systems. • Attributes considered included: • Simplicity, Data Quality, Acceptability, Sensitivity, Representativeness, Timeliness, Stability, Usefulness • Only national system to track first-time migrants with TB conditions • Standard system for all jurisdictions • Electronic system provides real-time data sharing • Easy and straightforward to use once initial access obtained • Fully operational 75-100% of time • Assessed by comparing: • Number of completed evaluations documented in EDN at baseline • Number total of completed evaluations after data entry (gold standard) • Of total follow-up evaluations completed, 36.3% documented in EDN at baseline • All time intervals were significantly longer during H1N1 pandemic • Biggest time difference is disposition to physician signature, with 118.5 days during and 29 days after H1N1 Table 2: Comparison of time intervals during and after the H1N1pandemic • EDN users with direct access (Direct Users) • 100% (3/3) easy to use • 100% (3/3) easy to learn • 66.7% (2/3) not easy to gain initial access • Local health departments without EDN access (Non-Direct Users) • 100% (5/5) easy to fill out form • 60% (3/5) have problems sending back worksheet • Participation • Weaknesses of Use of EDN in Illinois • All immigrants and refugees with TB conditions • U.S. arrival between October 1, 2008-September 30, 2010 • Illinois destination address • Representativeness • Data quality • Low proportion of data entered in Illinois • Timeliness of follow-up evaluation data entry • Follow-up data entry is unstable, especially when resources are low • There was a significant difference in distribution of worksheet status at baseline and after data entry (p<0.01). Figure 2: Distribution of Worksheet Status in EDN at Baseline and After Data Entry (N=1807) • Electronic Disease Notification (EDN) System • Data Quality • DataCollection • After data entry, number of started worksheets, completed worksheets and completed evaluations in EDN dramatically increased Figure 1: Complete* Worksheets in EDN at Baseline and After Data Entry (N = 1807) • CDC surveillance system that tracks U.S.-bound migrants requiring medical follow-up • Notifies states of newly arriving migrants • Captures data from domestic follow-up medical evaluations • Accessed through CDC Secure Data Network • Replaced Information on Migrant Population (IMP) System, to which states did not have access, in October 2008 • General Conclusions • EDN data extraction on Oct 15, 2010 (baseline) • High-priority variables identified by IDPH • Medical record review to obtain unrecorded data • Collected high-priority variables and entered into EDN • Compared data in EDN at baseline and after data entry • User interviews regarding EDN • Conducted in-person or over phone (n=9) • Use of EDN’s follow-up module is low in Illinois • Does not accurately portray follow-up evaluation efforts • As changes to EDN occur, additional guidance, training, and resources for health departments may improve use of the follow-up module • Recommendations *Medians calculated only for migrants with U.S. arrival during specified time frame **Medians calculated only for completed evaluations during specified time frame • Complete EDN Data Flow • CDC/DGMQ • Data Analysis • Improve online guidance on how to fill out worksheet • Consider electronic version of worksheet for non-direct users • Send feedback, summary and surveillance reports to users • Develop reminder system for pending or incomplete reports • Completed using SAS 9.2 • Data Quality • Percent complete at baseline and after data entry • Acceptability • Proportion of worksheets complete by county at baseline and after data entry • Timeliness • Median days between time intervals • Stability • Median time intervals over a 3-month period during and after the 2009 H1N1 pandemic • During H1N1 pandemic (April 22nd- July 22nd 2009) • After H1N1 pandemic (April 22nd – July 22nd 2010) • Kruskal-Wallis non-parametric test • Representativeness • Comparison of distribution of TB follow-up worksheet completion status at baseline and after data entry • Sensitivity • Completed follow-up evaluations recorded in EDN at baseline compared to follow-up evaluations actually completed • EDN interview results were compiled to assess simplicity, stability, usefulness, and acceptability EDN User Interviews on Stability • EDN system itself is fully operational, but stability of follow-up is affected by lack of resources • 100% direct EDN users stated system was operating fully 75-100% of the time • 62.5% EDN users (direct and non-direct) stated related activities not a priority when resources are limited • Illinois • Consider resources needed to improve follow-up data entry • Allow EDN access at local level • Provide guidance and recurring training for LHD • Especially on how/when to fill out worksheets for those who never initiate a follow-up evaluation • Develop reminder and tracking system for LHD • Timeliness • Usefulness • EDN Data Flow in Illinois • The time interval from disposition to EDN entry is where most improvement can be made in Illinois Table 1: Timeliness of Steps in EDN Process • 66.7% said EDN did NOT provide adequate data for surveillance of analysis • 100.0% said EDN did NOT produce adequate feedback or reports on data in EDN Users’ Suggestions for Making EDN More Useful • Users to CDC/Division of Global Migration and Quarantine (DGMQ) • Provide summary reports on worksheets completed/worksheets outstanding • Supply regular surveillance reports • Send reminders for pending worksheets • Create online instructions on completion of worksheet • Local Health Departments (LHD) to Illinois State • Make worksheet electronic to send back through email • Send reminders/mechanism to track “pending” worksheets • Incorporate into Illinois National Electronic Disease Surveillance System • Train healthcare providers on filling form out, sending form back, requesting replacement forms, etc. • Acknowledgements • Acceptability • Overall low acceptability Completion Rate by County • Worksheet completion rate at baseline • Mean rate: 23.5% • Range: 0% to 61.7% by county • Worksheet completion rate after data entry • Mean rate: 93.5% • Range: 64.8% to 100.0% by county EDN User Interviews • EDN user interviews indicated low willingness to use system • 62.5% (5/8) did not perform related activities on a regular basis (direct and non-direct users) • 60% (3/5) felt like filling out form takes away from other duties (non-direct users) Neha Shah, MD & Josh Jones, MD, Chicago Department of Public Health Demian Christiansen, DSc, Cook County Department of Public Health Michael Arbise & Peter Ward, Illinois Department of Public Health • Contact Information • Teal R. Bell, MPH • CDC/CSTE Applied Epidemiology Fellow • Quarantine and Border Health Service Branch • Division of Global Migration and Quarantine • Tel: 404-718-1188 • TRBell@cdc.gov • Objectives • Evaluate migrant follow-up in EDN to determine timeliness and completeness • Determine where improvements can be made to ensure migrants with TB conditions receive prompt follow-up • Explore why there are low rates of data entry into EDN’s follow-up module by Illinois • Make recommendations to improve rates of follow-up and EDN data entry • This study was supported in part by an appointment to the Applied Epidemiology Fellowship Program administered by the Council of State and Territorial Epidemiologists (CSTE) and funded by the Centers for Disease Control and Prevention (CDC) Cooperative Agreement Number 5U38HM000414 *Excluded negative time intervals **IQR = Inter-quartile range; used to control for data accuracy issues ***Used baseline data only