Download
1 / 38
380 likes | 552 Views
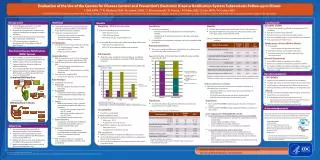
National Emerging Infectious Diseases Laboratories Risk Assessment. NIH Blue Ribbon Panel Boston Community Meeting April 28, 2010. Event Sequence Analysis. Ken Bulmahn. Risk Analysis. What could go wrong? What is the likelihood/probability? What are the consequences?

E N D
National Emerging Infectious Diseases Laboratories Risk Assessment NIH Blue Ribbon Panel Boston Community Meeting April 28, 2010
Event Sequence Analysis Ken Bulmahn
Risk Analysis • What could go wrong? • What isthe likelihood/probability? • What arethe consequences? In the context of the NEIDL and three alternative sites.
Process Overview Identify candidate events Categorize and select events Fully analyze events Estimate initial infections Assess transmission potential Model secondary transmission Characterize risk
Scope of Event Sequence Analyses • Identify, characterize, analyze events • Includes initiating and subsequent events • Includes both • Variety of plausible scenarios • Highly unlikely but credible, high-consequence event(s) – maximum reasonably foreseeable • End result: estimates of frequency and number of exposures, and extent of exposure, for event-pathogen pairs
Maximum Reasonably Foreseeable • Includes events with potentially catastrophic consequences • Includes low probability events provided the analysis is “supported by credible scientific evidence, is not based on pure conjecture, and is within the rule of reason” • Sufficient to consider events occurring more than once per million years, but not less frequently
Step 1 -- Identify Candidate Events BRP guidance and NRC technical input NEIDL design and operating plans Site characteristics Previous studies and analyses of similar facilities Public comments List of candidate events Natural phenomena Externally initiated Malevolent acts Internally initiated
Step 2 -- Define Event Sequences • Initiating event and subsequent events • Effect of preventive and mitigative features • Administrative controls (training, procedures) • Safety equipment (respiratory protection) • Facility (ventilation) • Describe possible impacts
Step 3 -- Assign Event Categories • Location • BSL-3 • BSL-4 • Other internal areas • External areas • Exposed groups • Laboratory worker • Facility worker • Public • Animal reservoirs and vectors • Initial route of exposure • Direct contact • Ingestion • Inhalation • Sharps/punctures • Animal or arthropod related
Step 4 -- Estimate and Assign Event Frequencies • Routine • High • Moderate • Low • Beyond reasonably foreseeable • Yearly • Once per 100 years • Once per 10000 years • Once per million years • Less than once per million years
Step 5 -- Select Events for Detailed Analysis Events include • Maximum reasonably foreseeable • Various initiating events, locations, exposed groups, routes of exposure • Different frequencies • Events that differentiate pathogens and sites • Overall range of things that could happen
Step 6 -- Add Pathogens to Events • Pair up events with pathogens pertinent for that event • Gives a series of E-P pairs for further analysis • For example • Centrifuge, BSL3, Yersinia pestis • Spill , BSL4, Ebola • Include all 13 pathogens • Include broad range of events
Example of E-P pair • Event = centrifuge accident • Location = BSL 3 • Route = inhalation • Frequency = high • Exposed = lab worker • Pathogen = Y. pestis • Preventative features = respiratory protection ventilation, SOPs, training
Step 7 -- Analyze Selected E-P Pairs and Estimate Consequence • Number of lab workers exposed • For example, 2-4 lab workers, no facility workers • Size of release to community/environment • Area affected by release • Amount of pathogen encountered • For example, 1000 bacteria
Results of Event Sequence Analysis • List of E-P Pairs • Estimated frequencies • Estimated number of exposures • Estimated extent of exposure
Health Effects and Transmission Modeling Adi Gundlapalli
Process Overview Identify candidate events Categorize and select events Fully analyze events Estimate initial infections Assess transmission potential Model secondary transmission Characterize risk
Step 1 -- Estimate Initial Infections • Considerations: • Exposure to infection • Infectious dose • Morbidity and fatality rates • Route of exposure • Populations
Exposure to Infectious Agent • Amount of and route of exposure • Outputs from event sequence analysis • Pathogen characteristics • Viability/pathogenesis/virulence • Infectious dose or experimental ID50 • Exposed individuals • Susceptibility and immune status • Likelihood of receiving prophylaxis and/or treatment • Lab and/or facility workers • General public and vulnerable sub-populations
Infectious Dose • Limited availability of human data (4/13) • Additional estimates of human infectious doses will be generated by expert consultation process to estimate the number of organisms that can be expected to cause infection in exposed individuals
Initial Infections • Not every exposure will result in infection • Estimates based on: • Literature data for all 13 pathogens • Review of BRP guidance • Results of expert consultation • Results: number of initial infections out of number of exposed people • Frequency of morbidity • Frequency of mortality • Perform uncertainty analyses
Step 2 -- Assess Transmission Potential • Potential for spread of infection from initially infected people to other people, to give secondary infections. • Analyze all 13 pathogens • Potential for establishment of infection in animals or the environment
Possible Scenarios • Lab / facility worker event sequence • Event leads to exposure of lab/facility worker(s) • Exposure results in infection • Exposure/infection is undetected or unreported • Infectious worker interacts with contacts • Direct-to-community event sequence • Event leads to direct exposure of members of public • Exposure results in infection(s) • Infectious individuals interact with contacts • Escape of infected arthropods or animals • Establish reservoir and spread infection
Secondary Transmission Potential • Indirect transmission (via animals or arthropods) • Yersinia pestis (bubonic plague) • Francisellatularensis • Rift Valley fever virus • Tick-borne encephalitis complex (Russian spring-summer encephalitis virus) • No known person-to-person transmission • Bacillus anthracis • Qualitative discussion for all 13 pathogens • Direct person-to-persontransmission • SARS-associated coronavirus • 1918 pandemic influenza virus • Yersinia pestis (pneumonic plague) • Andes hantavirus • Junin virus • Lassa fever virus • Marburg virus • Ebola virus • Nipah virus
Establishment of Reservoirs of Infection • Reservoirs of infection • An animate object or inanimate substance in which a pathogen normally lives and multiplies • Establishes potential for transmission of pathogen to humans • Assess potential of pathogens to establish reservoirs • As it pertains to human health • Environmental (soil) • Arthropod (mosquitoes, fleas, ticks) • Animal (rodents, ruminants)
Step 3 -- Quantitative Secondary Transmission Modeling • Pathogen selection criteria • Consider all 13 pathogens for transmission modeling • Models and adequate data are limiting factors • Based on criteria • Five pathogens chosen for detailed quantitative modeling • Qualitative discussion for remaining eight
Quantitative Secondary Transmission Modeling • Model selection criteria • Published and peer-reviewed • Adequate data for model inputs • Amenable to uncertainty / sensitivity analysis • Suitable for scenarios relevant to NEIDL • Small and large scale accidents • Possibility of high-consequence outcomes • Effects of public health intervention • Site differences
Branching Process Modeling • Advantages • Probabilistic and individual-based • Well-developed literature in epidemiology • Impose variability in individual transmission • Better capture observed frequency of extremes • Incorporate mitigation and demographics • Balance of detail, data requirements and insight • Challenges • Not suitable for large outbreaks
Details: Branching Process • Infected individuals given reproductive number • Expected number of transmissions • Mean R0, with distribution around R0 • Example simulation result: Z = number of transmissions (based on reproductive number) Lloyd-Smith et al., Nature (2005) Z=1 Z=2 Z=0 Z=3 Z=0 Z=0 Index CaseZ=0
Compartmental Modeling • Advantages • Aggregate populations into compartments • Widely published and well understood • Generally deterministic • Decreasing transmission rates due to decreasing susceptible individuals • Incorporate mitigation and demographics • Balance of detail, data requirements and insight • Challenges • No variation in transmission • Not suitable for small outbreaks
αJ Q J σQ υQ γJ c1E c2I I E S R βSI σE γI αI υE Compartmental Model with Quarantine & Isolation Q = Asymptomatic/in quarantine J = Infectious/in isolation S = Susceptible E = Exposed and asymptomatic I = Infected and symptomatic R = Recovered and immune
Hybrid Modeling Approach • Use branching and compartmental models • Combine strengths of both models • Transition from one to the other • Criteria for transition • As number of infections crosses threshold • When stochastic extinction becomes unlikely • When significant portion of population is infected • Potential scenarios • Modeling unmitigated transmission • Control measures do not extinguish outbreak
Output of Modeling Analyses • Run large number of simulations • Calculate average results, confidence intervals • Total number of infections, fatalities • Tally simulations in which • No transmission occurred • Small outbreak occurred and extinguished • Large outbreak occurred • Analyze high-consequence simulations
Site Differences: Secondary Transmission • Size and density of population • Lab/facility worker commuting patterns • Contact rate differences in urban/suburban/rural • Differential access to medical/public health services • Health status of local community • Special geographic consideration: • Spread from semi-urban or rural NEIDL site to Boston
Summary • Event sequence analysis • Generate comprehensive list of candidate events • Use defensible approach to select range of events • Analyze events to estimate risk of release • Health effects and transmission analysis • Generate estimates of initial infection using literature and expert opinion • Assess secondary transmission potential for all pathogens • Select representative agents for transmission modeling • Use established mathematical modeling approaches • Present typical and high-consequence events • Analyze differences between sites
Characterize Risk • Summarize risk of • Exposures • Infections and fatalities • Secondary transmissions • Synthesize key findings • Summary of risk to exposed groups • Potential differences between sites • Disproportionate impacts to vulnerable sub-populations