Download
1 / 28
280 likes | 819 Views
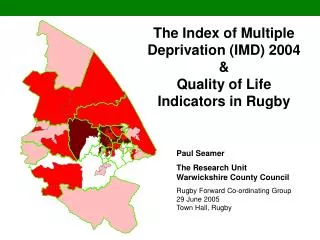
The Index of Multiple Deprivation (IMD) 2004 & Quality of Life Indicators in Rugby Paul Seamer The Research Unit Warwickshire County Council Rugby Forward Co-ordinating Group 29 June 2005 Town Hall, Rugby IMD 2004 – National, County & Rugby specific context

E N D
The Index of Multiple Deprivation (IMD) 2004 & Quality of Life Indicators in Rugby Paul Seamer The Research UnitWarwickshire County Council Rugby Forward Co-ordinating Group29 June 2005Town Hall, Rugby
IMD 2004 – National, County & Rugby specific context • Quality of Life – Key indicators in Rugby Borough
IMD 2004 • The IMD 2004 is a Super Output Area (SOA) level measure of multiple deprivation • Wow! – Sounds impressive, BUT what does that actually mean?
Multiple Deprivation • Distinct dimensions of deprivation and disadvantage which can be idenitified and measured separately (Domains) • People may be counted in one or more Domains depending on the number of types of deprivation they experience
IMD 2004 consists of seven distinct domains (and a number of sub-domains) • Each domain is built from a number of unpublished indicators (e.g. adults and children in Income Support households)
The seven domains are: • Income Deprivation (with sub-domains income deprivation affecting children and older persons) • Employment Deprivation • Health Deprivation & Disability • Education, Skills & Training Deprivation • Barriers to Housing & Services • Crime & Disorder • Living Environment
Super Output Areas • Super Output Areas (SOAs) are replacing electoral wards as the primary means of dissemination of small area Government (and other) statistics. • Built from postcode based Census Output Areas • Three types of SOA – lower, middle and upper layer
IMD 2004 is at the lower layer: smaller than an electoral ward – c.1000-2000 people. • There are 32,482 SOAs (lower layer) in England; 333 in Warwickshire (cp. 105 wards)
Due to different domains, indicators and the new SOA geography forget any comparison with IMD 2000 • A full report on IMD 2004 for Warwickshire is available at:www.warwickshire.gov.uk/deprivation
Key Findings – Overall IMD 2004 • 37 Warwickshire SOAs in total feature in most deprived 30% nationally • There are 2 Warwickshire SOAs within the most 10% deprived in England – within Bar Pool and Camp Hill wards. • A further 15 Warwickshire SOAs feature in most deprived 20% and a further 20 in the most deprived 30% of SOAs in England
26 of the 37 Warwickshire SOAs within the most deprived 30% nationally are in Nuneaton and Bedworth. • 5 are within Warwick, 4 within Rugby and 2 within North Warwickshire. • The 4 Rugby SOAs are within Brownsover South (worst 20%), Newbold (town centre), northern Overslade & Newbold-on-Avon.
Warwickshire SOAs featuring in the most and least deprived nationally
National comparisons are clearly useful but additional analysis in a local context is also possible (e.g. Rugby rankings 1 – 58)… • …and by individual domains (types of deprivation)
Health Deprivation & Disability – Rugby ContextIdentifies areas with relatively high rates of people who die prematurely or whose quality of life is impaired by poor health or who are disabled, across the whole population.
Similar patterns emerge when looking at the different domains • SOA’s enable local level focus, but district level data is also of use, to gain a high level overview. • Quality of Life provides us with district level data
Quality of Life 2004 • QoL is comprised from a number of Economic, Social and Environmental and Natural Resource indicators. • Rugby borough is most closest aligned to the Warwickshire average on a number of indicators. • Progress in Education & Health over the last 12 months • Many other indicators remain unchanged.
Indicator Satisfaction with Health Services Trend over time Compared with national average . . Compared with Warwickshire average q Years of Life Lost p p Life Expectancy p p Mortality Rates p Smoking Cessation . . . . . . Key p Good performance Moderate performance q Poor performance . . Information not available or not applicable at District level Health
Pre-school Provision Indicator p Trend over time . . Compared with national average Compared with Warwickshire average Key Stage 2/3 Attainment p p GCSE Attainment School Leaver Destinations . . . . Key p Good performance Moderate performance q Poor performance . . Information not available or not applicable at District level Education p p p Unauthorised Absence from School
Fear of Crime Indicator q Trend over time Compared with national average . . q Compared with Warwickshire average Recorded Crime p q Disorder Incidents . . q Substance Misuse . . q Youth Offending . . q Key p Good performance Moderate performance q Poor performance . . Information not available or not applicable at District level Crime & Disorder
Bus Service Satisfaction Indicator Trend over time q . . Compared with national average p Compared with Warwickshire average Travel to School q q Travel to Work q p p Traffic Volumes & Congestion q . . q Road Casualties p . . Cycling q p p Key p Good performance Moderate performance q Poor performance . . Information not available or not applicable at District level Travel
www.warwickshire.gov.uk/researchIMD 2004www.warwickshire.gov.uk/deprivationQuality of Life in Warwickshirewww.warwickshire.gov.uk/qualityoflife
Further Information • Research Unit • PT&ES Department • Warwickshire County Council • 01926 412775 • research@warwickshire.gov.uk "www.warwickshire.gov.uk/research