SAACE CONFIDENCE INDEX
SAACE CONFIDENCE INDEX. Trend in REAL PRIME INTEREST RATE and Building plans passed Based on 13 month moving average 1983 - 2001. SAACE CONFIDENCE INDEX According to size of company. Profitability According to size of company. Leading indicators SACOB vs SAACE. SAACE Fee income vs confidence.
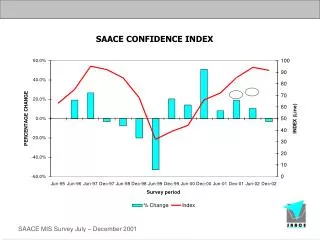

SAACE CONFIDENCE INDEX
E N D
Presentation Transcript
Trend in REAL PRIME INTEREST RATEand Building plans passedBased on 13 month moving average1983 - 2001
Company Profile Employment Number of companies
Sub-marketsR mill, constant pricesTop five sub-markets (Based on old definitions)
Sub-marketsMarket Share:Top five sub-markets Combined these sectors represent 75% of the market
Provincial Market Share July - December 2001 Fee income
Provincial Market Share As at Dec’01 and % Change on Jun’01
Provincial Market Share: Construction As AT Dec’01 Based on contract awards: July – December 2001
Income generated in Africa and across bordersR mill, constant prices
Client distribution R mill, Constant 1995 prices
Economic Product Cycle Indicators Summary Work in: Enquiries, Pre-feasibility, Pre-plan Work out: Detail plan, Adjudication, Construction
Economic Product Cycle Indicators ENQUIRIES
Economic Product Cycle Indicators WORK FLOWING IN
% of Firms wanting to increase staff Engineers
Employment Breakdown Workforce Analysis July – December 2000 Disabled = 0,6%
Employment Breakdown Workforce Analysis July – December 2000
Employment Breakdown Workforce Analysis January – June 2001 Disabled = 0,2%
Employment Breakdown Workforce Analysis January – June 2001
Employment Profile July – December 2001
Employment trends 1999 - 2001
Bursaries % of Salary / Wage bill
Training % of Salary / Wage bill
Total fee income outstanding as percentage of total potential fee income By type of client
Fee income outstanding for longer than 90 days as percentage of total potential fee income By type of client Possible distortions in Dec01 due to changes in questionnaire
Approximately R358 million in real terms, are outstanding for longer than 90 days as at December 2001
Total fee income outstanding For longer than 90 days
Total fee income outstanding For longer than 90 days Central
Total fee income outstanding For longer than 90 days Provincial
Total fee income outstanding For longer than 90 days Local