Download
1 / 36
590 likes | 1.82k Views
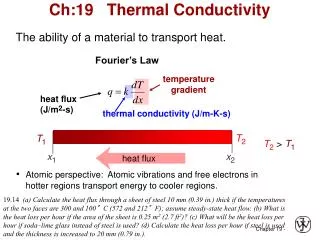
Thermal Conductivity of Nanofluids. Siw, Sin Chien University of Pittsburgh ENERGETICS ME 3007 Oct 27, 2008. Outline. Introduction Objective Experimental results Simulation results Discussion and Comments Conclusion. Introduction.

E N D
Thermal Conductivity of Nanofluids Siw, Sin Chien University of Pittsburgh ENERGETICS ME 3007 Oct 27, 2008
Outline • Introduction • Objective • Experimental results • Simulation results • Discussion and Comments • Conclusion
Introduction “ Nanofluid” is the name conceived to describe a fluid in which nanometer-sized particles are suspended [Choi 2008]. knanoparticles > kbase fluids X. Q. Wang & A.S. Mujumbar [2007]
Introduction-Why? • Early days, researchers - heat transfer performance of fluid - changing flow geometry - boundary conditions - enhancing thermal conductivity of the fluid-dispersion of particles • Base fluid can be enhanced by suspending micro/larger size solid particles. - large particles (micron size) ~ higher density , settling down - induced additional flow resistance ~ possible erosion • - basic concept of dispersing solid particles in fluids to enhance thermal conductivity can be traced back to Maxwell in the 19th Century. • - confined to mm-sized particles. • - major challenge is the rapid settling of these particles in fluids. • Nanoparticles stay suspended much longer than micro-particles and, if below a threshold level and/or enhanced with surfactants/stabilizers, remain in suspension almost indefinitely. • - surface area per unit volume of nanoparticles is much larger (million times) than that of microparticles (the number of surface atoms per unit of interior atoms of nanoparticles, is very large).
Introduction Table 1 : Comparison of the Old and New [Sarit K. Das et. a.l. 2008]
Introduction • Unprecedented growth in electronics, communication and computing technologies - Increasing power , decreasing size, higher heat capacity ~ demand for suitable for next generation of flow and heat transfer (innovative cooling technology) • Conventional method to increase heat flux rates: - extended surfaces such as fins and micro-channels - increasing flow rates increases pumping power • However, current design solutions already push available technology to its limits. • NEW Technologies and new, advanced fluids with potential to improve flow & thermal characteristics are of critical importance • Nanofluids are promising solution to meet and enhance the challenges
Introduction Particle Size Base fluid material Particle material Thermal ConductivityEnhancement pH Particle volume concentration Temperature
Objectives • Explore the experimental and simulation results of thermal conductivity enhancement reported by researcher in the recent years. • Compare the experimental and simulation results. • Identify the current issues in nanofluids.
Experiment – Preparation of nanofluids • 2 techniques - The single step method The single step simultaneously makes and disperses the nanoparticles directly into a base fluid; best for metallic nanofluids. - Nanoparticles agglomeration is minimized (Pros) - Only suitable for low vapor pressure fluid (Cons) • - The two-step method (widely used) Nanoparticles was first produced and dispersed into the base fluids. • - Good for oxides nanoparticles(Pros)- Not suitable for metallic nanoparticles (Cons)
Experiment – Preparation of nanofluids Figure 3: Cu nanoparticles in ethylene glycol produced with One Step method Figure 2: ZrO2 in water that produced with Two Step method
Experimental Results – Effect of Particle Size Figure 4 Effect of particle size for Al2O3 in water [Chon C.H. et. al. (2006)] Figure 5 Effect of particle size for Al2O3 in ethylene glycol [H.U. Kang et. Al. (2006)] • smaller particles, higher thermal conductivity - effective surface area increase as particle size decrease- increment due to Brownian motion- exponential increment as size getting smaller
Experimental Results – Effect of Particle Shape cylindrical shape cylindrical shape Figure 6 Effect of particle shape for SiC in water Figure 7 Effect of particle shape for SiC in water • cylinder shape nanoparticles ~ extended profile/geometry that can transport heat rapidly over significant distance. • - High aspect ratio nanoparticles may aligned parallel to the temperature gradient ~ enhance keff
Experimental Results – Effect of Temperature Figure 9 Effect of temperature for Al2O3 in water Figure 8 Effect of temperature for Al2O3 in water • temperature increment reduce the viscosity of the nanofluids – promote Brownian motion • same volume fractions, highest thermal conductivity ~ highest temperature. • ~ 7% - 10% increment for temp. range from 28oC – 35oC.
Experimental Results – Effect of Temperature 1.62 1.26 Figure 10 Effect temperature for MWCNT in water Figure 11 Effect temperature for MWCNT in water • temperature increment reduce the viscosity of the nanofluids • - Inconsistency; At 0.4% volume fraction – different keff
Experimental Results-Volume fraction Figure 12 Particle volume fraction effect of Ag in water [ H.U. Kang et. al. (2006) ] Figure 13 Particle volume fraction effect of Si in water [ H.U. Kang et. al. (2006) ] • Silver nanoparticle (~8-15nm) ; Silica nanoparticle (~15-20nm) • keff increase with volume fraction
Simulation Results Maxwell was one of the first to analytically investigate conduction through suspended particles. This equation and other equations for thermal conductivity e.g., Hamilton and Crosser, and Rayleigh predict thermal conductivity reasonably well for dilute mixtures of relatively large particles in fluids. When we go to the nanoscale we have to consider some effects that do not exist in large scales. To improve the predictions we consider: 1- Effect of nanoparticle-matrix interfacial layer 2- Effect of nanoparticle Brownian motion 3- Effect of nanoparticle cluster/aggregate
Simulation Results – Jang and Choi (2007) • Investigate the effects of various parameters • 1. ratio of the thermal conductivity of the nanoparticles to the base fluid • 2. volume fraction • 3. nanoparticle size • 4. temperature effect • Model of Nanofluid Thermal Conductivity – 4 modes • 1st mode ~ Base Fluid Molecules • 2nd mode ~ Nanoparticles • 3rd mode ~ Collisions of Nanoparticles with Each Other • 4th mode ~ Nanoconvection
Simulation Results – Jang and Choi 1st Mode - Base Fluid Molecules ~ derived based kinetic theory f = volume fraction kBF = thermal conductivity of the base fluid molecules Ĉv = heat capacity per unit volume = mean speed of molecules l = mean free path T = temperature ~ collisions of base fluid molecules with each other – indicate the heat transfer by thermal conductivity
Simulation Results – Jang and Choi 2nd Mode – Thermal Diffusion of Nanoparticles knano = thermal conductivity of nanoparticle = mean speed of free electron lnano = mean free path of heat carriers in nanoparticles ~ diffusion of nanoparticles ~ knano, thermal conductivity of nanoparticles using Chen’s correlation β = Kapitza resistance per unit area ~ 0.01
Simulation Results – Jang and Choi 3rd Mode – Nanoconvection - collisions between base fluid molecules and nanoparticles by thermally induced fluctuations - assume linear temperature profile in thermal boundary layer h = heat transfer coefficient δT = thermal boundary layer f = volume fraction
Simulation Results – Jang and Choi 4th Mode – Collisions of Nanoparticle with Each Other Flux energy by collision of nanoparticles ~ Brownian motion (minimal effect among all modes) Effective Thermal Conductivity of Nanofluids C1=18x106
Simulation Results – Jang and Choi Figure 13 Effect of diameter of nanoparticle on thermal conductivity of nanofluids [Jang & Choi 2007] - Size nanoparticles reduced, thermal conductivity increased. ~ Brownian motion is greater, nanoconvection become dominant. - Maxwell model only valid as the size of the nanoparticles is greater than 30nm.
Simulation Results – Jang and Choi Figure 14 Experimental data for temperature-dependent conductivity of the prediction from Jang & Choi model as comparison to Maxwell model [Jang & Choi 2007]. • ~3 times increment over a small temperature range (20-50oC). • Temperature increased, dynamic viscosity decreased • ~ nanoconvection remarkably increased with temperature.
Simulation Results – Monte Carlo Figure 15 Comparison between simulated effective thermal conductivities with the experimental data (Al2O3-EG) [Yongjin Feng et al. 2008] • Parameters in M.C. simulation • ~ 1. thermal conductivities of base fluid and nanoparticles • 2. volume fraction • 3. size of nanoparticles & cluster generation effect • 4. interfacial resistance
Simulation Results – Monte Carlo Figure 16 Monte Carlo simulation at different volume fraction as a function of radius of gyration [W. Evans et. al 2008] Figure 17 Effective thermal conductivity for different aggregated clusters [W. Evans et. al. 2008] • Monte Carlo Simulation • ~ As cluster size increased, keff increases rapidly. ~ promote rapid conduction • ~ Size of the cluster – too big? Optimum size?
Contradiction Thermal conductivity computed from integrated heat flux autocorrelation function [C.Nie et.al. (2008)]:- with = heat flux = position of the fluid molecules = entropy of the fluid molecules = total energy of the fluid molecule including kinetic energy and interaction potential = velocity of the fluid molecules
Contradiction Contribution to the keff due to the Brownian motion of nanoparticles :- kB = Boltzmann constant keff = f (Φ, T, 1/R, 1/µ) • keff enhancement ~ due to Brownian motion is proportional to volume fraction • Temperature increase causes viscosity of decrease ~ keff increased • ~ e.g. @ 300K, using water as base fluid with μ=7.978 × 10⁻⁴ Pa.s keff ~ O(10-15W/mK)
Contradiction It is recognized that the thermal conductivity in fluid and solid components of the nanofluid is related to the type of phonon excited, the phonon mean path, and the phonon transport speed, i.e., the speed of sound in the medium. [J.Che et al, 2000] Figure 18 Density distribution for water around a nanoparticle of 30nm @ 320K [C.Nie et. al 2008] • Density distributions around a nanoparticle ~ are nearly the same. • Low volume concentration of nanoparticles, ~ mean free path of phonon nearly the same. • Phonon transport speed is related to the speed in the fluid C = sound speed ĸT = compressibility of material (can be determine from E.O.S)
Contradiction • Ps = Pressure contribution from fluid molecules • Pc = Pressure contribution from the suspended cylinder • α = free volume fraction • η = packing factors (e.g. for water ~ 0.466) • n = number density • negligible changes in compressibility, ~ very small speed of phonon transport • Proposed Brownian motion has negligible effect. • No enhancement effect
Discussion & Comments - keff of alumina nanofluids ~ 8% to 33% - There is no clear indication about the enhancement rate - keff varies in the first 5 days, reproducible keff value is achieved later.
Discussion & Comments Figure 19 Effect of aging in the water based nanofluids on thermal conductivity [Timofeeva et. al 2007] - keff of alumina nanofluids ~ 2% to 17% in 7 days period - There is no clear indication about the exact enhancement rate - keff varies in the first 5 days, reproducible keff value is achieved later. ~ Why?
Discussion & Comments Experimental and Simulation approach ~ Comparison • No tools/equipments that is capable to capture any visual data that can clearly explain this behavior as compare to macroscale experimental (e.g. internal flow ~ laminar and turbulent flow) ~ Dynamic Light Scattering (DLS) and Scanning Electron Microscopy (SEM) latest approach used to study the structure of the nanoparticles ~ DLS – limited to low volume fraction nanofluids (Φ<1.0%) ~ SEM – can only be performed after drying the base fluid. - Lack of agreement between experimental results from different groups - Lack of theoretical understanding of the mechanisms • Jang and Choi ~ No cluster generation effect Monte Carlo ~ Maximum size of the clusters is preset? Will the size of the cluster keep growing? ~ What if the clusters is too heavy and difficult to suspend? ~ Collisions of nanoparticles is not considered ~ Nanoconvection is not considered
Remaining Challenges 1. Nanoparticles may form agglomerates and settle rapidly - forming a layer on the surface and reduced the overall heat transfer capacity 2. Larger nanoparticles or agglomerates may clog the narrow cooling channels 3. Pressure drop of the fluid increases considerably - Suitable choice of base fluid and nanoparticles for optimum performance. 4. Brownian motion effect – controversial - may need to be revisited – particularly on the effect of temperature
Discussion & Comments • Some of the reported Application • Transportation (2005) ~ CuO nanoparticles in engine transmission oil, claims to lower the transmission temperature at both high and low rotating speed. ~ any corrosive effects? • Electronics Cooling (2004) ~ Tsai et al used a water based nanofluid as working medium in a circular heat pipe - CPU and notebook- positive results as compare to deionized water. • 3.Defense (2007) ~ Transformer cooling (Navy) – nanofluid to replace the transformer oil. • Space (2004) ~ Vassalo et al. reported a magnitude increase in the critical heat flux in pool boiling with nanofluids compared to base fluid alone. - potential for space applications ~ high power density. • Nuclear System Cooling(On-going) ~ MIT explore the impact of using nanofluids on the safety, neutronic and economic performance of nuclear systems. • Biomedicine (1999) ~ Jordan A. et al. reported that nanofluids can produced high temperature around tumor to kill cancerous cells without affecting healthy cells.
Conclusion 1. Nanofluids development is still considered in the research stage ~ many factors need to be explore and optimized in both experimental and computational areas. ~ Issues/problems (e.g. nanoparticles agglomeration, settling, erosion potential and etc needs to be addressed) ~ The parameters chosen in the simulation is based on the researchers experience, instinct findings. 2. Heat transfer data are somewhat sparse. ~ no clear trends for application guidelines 3. Results may not be repeatable. ~ keff varies at time period. 4. Different types of base fluids (water, E-G, and etc) and nanoparticles (CuO, Al2O3, CNTs, etc) provide different enhancement ~ Suitable choice of base fluid and nanoparticles for optimum performance. 5. Ability to suspend the nanoparticles for a long period of time? – Clusters?