Download
1 / 50
510 likes | 955 Views
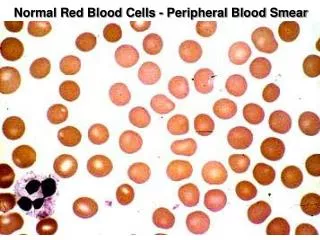
CAL-session. Peripheral Smear. Sarmishtha Ghosh Physiology. CBC. TOTAL RBC COUNT TOTAL WBC COUNT PERIPHERAL SMEAR SHAPE, SIZE & COLOR OF RBCs DIFFERENTIAL WBC COUNT PLATELET COUNT HEMOGLOBIN CONCENTRATION BLOOD INDICES – MCH, MCV, MCHC. 1. 2. 3. 4. Normal RBC distribution.

E N D
CAL-session Peripheral Smear Sarmishtha Ghosh Physiology
CBC • TOTAL RBC COUNT • TOTAL WBC COUNT • PERIPHERAL SMEAR • SHAPE, SIZE & COLOR OF RBCs • DIFFERENTIAL WBC COUNT • PLATELET COUNT • HEMOGLOBIN CONCENTRATION • BLOOD INDICES – MCH, MCV, MCHC
1 2 3 4
TAIL- TOO THIN, MACROCYTIC & FLAT HEAD- TOO THICK, SMALL & HYPOCHROMIC
Blood Indices • The relationships between the hematocrit, the hemoglobin level, and the RBC are converted to red blood cell indices through mathematical formulas. • These formulas were worked out and first applied to the classification of anemias by Maxwell Wintrobe in 1934. • The indices include these measurements: mean corpuscular volume (MCV); mean corpuscular hemoglobin (MCH); mean corpuscular hemoglobin concentration (MCHC); and red cell distribution width (RDW). They are usually calculated by an automated instrument as part of a complete blood count (CBC).
Mean corpuscular volume (MCV) • MCV is the index most often used. • It measures the average volume of a red blood cell by dividing the hematocrit by the red blood cell count. • The MCV categorizes red blood cells by size. • Cells of normal size are called normocytic, smaller cells are microcytic, and larger cells are macrocytic. Following formula is used to calculate MCV
Mean corpuscular hemoglobin concentration (MCHC) • measures the average concentration of hemoglobin in a red blood cell. • This index is calculated by dividing the hemoglobin by the hematocrit. The MCHC categorizes red blood cells according to their concentration of hemoglobin. • Cells with a normal concentration of hemoglobin are called normochromic; • cells with a lower than normal concentration are called hypochromic. • Because there is a physical limit to the amount of hemoglobin that can fit in a cell, there is no hyperchromic category. • Anemias are categorized as hypochromic or normochromic according to the MCHC index.
Mean corpuscular hemoglobin (MCH) • The average weight of hemoglobin in a red blood cell is measured by the MCH. • Anemias are categorized as hypochromic or normochromic or hyperchromic according to MCH index. • MCH is most useful in diagnosis of severely anemic patients. Among those with lesser degrees of anemia, it is less useful because the measurement has a potential for a relatively wide range of error. • MCH (in pg) = hemoglobin (in g/dL) x 10 ÷ RBC count (in millions/mm3)
Normal results for red blood cell indices are as follows: • MCV 82 to 98 fl (femtoliters) • MCHC 31 to 37 g/dl (or %) • MCH 26 to 34 pg (picograms)
MBBS 2012 LAB EXERCISES References cellbio.utmb.edu/microanatomy/Blood.htm Constructed by: Dr. Sarmishtha Ghosh
1 IDENTIFY WITH JUSTIFICATION : a,b,c,d
e f 2 a d b c
3 • 1) What is the advantage of the biconcave shape of RBCs? • 2) Why is the absence of a nucleus an advantage? R- Red Blood Cell N- Neutrophil E- Eosinophil
4 • 1) What is the function of N & E respectively? • 2) The eosinophil count of a patient is 7%. What might be the probable indications? R- Red Blood Cell N- Neutrophil E- Eosinophil
5 • Identify “X”. • What is it composed of? • What is its function in the body? X
6 • The photograph shows a Monocyte • What made you identify it to be a Monocyte? • Where would you expect monocytes to be in an infection? • What is their function?
7 • These cells in the are 25-33% of white blood cells. • What is it and what is its function?
8 • Identify Cell # 1 • Identify Cell # 2 • Identify Cell # 3
9 • This is a Lymphocyte. • State the Identifying features • Is this a T lymphocyte or a B- lymphocyte
10 A B C Comment on RBCs in the three slides A,B and C.