Download
1 / 20
200 likes | 292 Views
This study by David Groves at RAND provides insights on quantifying water demand for three 2030 scenarios. Learn about model building, scenario uniqueness, and key drivers for accurate quantification.

E N D
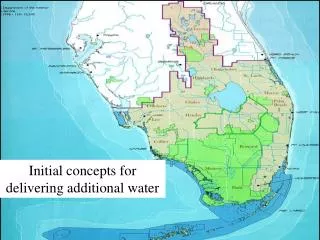
Initial Water Demand EstimatesFor Three 2030 Scenarios David Groves RAND
1st Cut at QuantifyingNarrative Scenarios • Steps • Build model • Identify parameter values unique to scenarios • Compute results
No single method for choosing numerical values for parameters • There is no “correct” scenario • Other modeling studies can inform quantification • Ex: DOF demographic projects – good choice for Current Trends • Important to quantify drivers independently of scenario results (water demand) • Check intermediate results for plausibility
Demand Driver Results • Please consult “Quantified Narrative Scenarios” hand-out • New rows…
Total Population Current Trends: DOF Resource Sustain: DOF Resource Intensive: Old DOF
Current Trends: DOF Resource Sustain: DOF Resource Intensive: DOF + 25% / 16% Population Distribution Population Change 2030-2000
Housing (Population Density) Current Trends: 36% MF housing (2000) Resource Sustain: 46% MF (+10%) Resource Intensive: 31% MF (-5%)
Employees Current Trends: Driven by population* Resource Sustain: Driven by population* Resource Intensive: Driven by population* *Replace with 2030 DOF projections when data available
Changes in Water Use Coefficients • Changes in WUC captures • Response to prices, income, natural conservation and efficiency • Current Trends • 10% decrease in WUC from 2000-2030 • Resource Sustainability • 20% decrease in WUC from 2000-2030 • Resource Intensive • 5% decrease in WUC from 2000-2030
Irrigated Area Current Trends: ICA – Current Trends, MA/ILA – 6%->10% Resource Sustain: ICA – Constant, MA/ILA – 6%->14% Resource Intensive: ICA – Constant, MA/ILA – 6%->23%
Irrigation Applied Water • Reflects all factors affecting water use per crop type • Also reflects changes in cropping patterns • Can disaggregate in future • Current Trends • 5% decrease in AW from 2000-2030 • Resource Sustainability • 10% decrease in AW from 2000-2030 • Resource Intensive • Constant AW
Environmental Water Demand • Unmet needs based upon memo from Environmental Defense (Dec. 8, 2003) • Current Trends • 100% Unmet Needs by 2030 • Resource Sustainability • 150% Unmet Needs by 2030 • Resource Intensive • 100% Unmet Needs by 2030
Urban Demand Change – by sector and zone 2030-2000 by Sector 2030-2000 by Zone South/dry = SC, CR, SL Valley = SR, SJ, TL North/coast = NC, SF, CC, NL
Urban, Ag, Envir. Demand By Region South/dry = SC, CR, SL Valley = SR, SJ, TL North/coast = NC, SF, CC, NL
Total Demand South/dry = SC, CR, SL Valley = SR, SJ, TL North/coast = NC, SF, CC, NL