Download

1 / 36
360 likes | 575 Views
Shear wave velocity structure estimation using surface waves of different wavelengths. New Knowledge and Measurements in Seismology, Engineering Geophysics and Geotechnics – OVA ’06 Ostrava, 17. a 18. dubna 2007. Petr Kolínský Department of Seismology

E N D
Shear wave velocity structure estimation using surface waves of different wavelengths New Knowledge and Measurements in Seismology, Engineering Geophysics and Geotechnics – OVA ’06 Ostrava, 17. a 18. dubna 2007 Petr Kolínský Department of Seismology Institute of Rock Structure and Mechanics Academy of Sciences of the Czech Republic and Department of Geophysics Faculty of Mathematics and Physics Charles University in Prague
frequency-time analysis – basics • multi-channel filtering • Gaussian filters • constant relative resolution filtering • optimal filtration • instantaneous period estimation • compilation of the dispersion curve using primary, secondary, ... local maxima
frequency-time analysis frequency - time representation using the Fourier Transform multi-channel filtering = the inverse FT for different central frequencies is a spectrum of the original signal is the Gaussian filter (weighting function) we obtain a set of filtered spectra
frequency-time analysis example of Gaussian filters
frequency-time analysis classical depiction of spectrogram amplitude frequency time group velocity - scale diagram period diagram
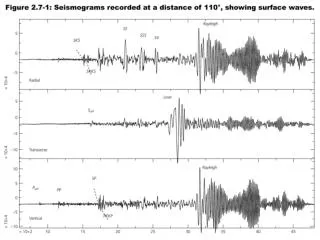
frequency-time analysis group velocity epicentral distance arrival time of energy maximum
frequency-time analysis example of several nearly monochromatic filtered signals example of truncating the filtered signals how to provide a proper truncating?
frequency-time analysis how the filtered seismogram is summed using the truncated filtered signals
frequency-time analysis filtered seismogram
inversion problem • Isometric Method (IM) was recently developed at Institute of Rock Structure and Mechanics, Academy of Sciences of the Czech Republic, by Jiri Malek • isometric algorithm connects the advantages of several commonly used methods, see: “Tarantola, A.: Inverse Problem Theory, Elsevier Science B.V, Amsterdam, 1987” • IM is a fast algorithm, which was developed for solving weakly non-linear inverse problems with many parameters
forward problem • forward problem is solved during almost all iterations of the inversion • the dispersion curves are computed by matrix method presented in: “Proskuryakova, T. A., Novotny, O. and Voronina, E. V.: Studies of the Earth Structure by the Surface Wave Method (Central Europe), Nauka, Moscow, 1981 (in Russian)” • It uses modified Thomson – Haskell matrices for Love waves • program for computing the forward problem was developed at the Department of Geophysics, Faculty of Mathematics and Physics, Charles University, Prague, by Oldřich Novotný
SVAL - program • The source code is written in PASCAL using Delphi environment (Borland, version 7.0). • The code emerges as a result of translation of other codes from FORTRAN language (Kolínský, Novotný). Then it was compiled together with code written in Delphi (Málek). • It is possible to distribute and execute the SVAL program using one *.exe file (3 MB).
results velocity models and inversion scattering measured and inverted dispersion curves
shallow seismic measurement • Date 2004 June • Magnitude very small :-) • event location 14.15 E 49.91 N (Karlštejn) • Depth surface • origin time 13:15:12 UTC • Source hammer beating a metal plate • epicentral distance 50 m • Station Karlštejn • station location 14.15 E 49.91 N • Seismometer SM 6 – 4 Hz
quarry blast • Date 2003 June 05 • Magnitude not estimated • event location 12.668 E 50.261 N (Horní Rozmyšl) • Depth surface • origin time 17:49:59.546 UTC • Source quarry blast • epicentral distance 28.954 km • Station Kynžvart KYNZ • station location 12.604 E 50.004 N • Seismometer Lenartz 3-D 5\,s \\
Aegean Sea Earthquake • Date 2005 October 20 • Magnitude 5.9 • event location 26.75 E 38.15 N (Aegean Sea) • Depth 10 km • origin time 21:40:04.09 UTC • Source natural tectonic earthquake • epicentral distance 1632.54 km • Station Háje HAJ • station location 14.04897 E 49.67474 N • Seismometer Guralp 30
South Iran • Date 2005 November 17 • Magnitude 6.0 • event location 55.847 E 26.784 N (South Iran) • Depth 10 km • origin time 10:22:19 UTC • Source natural tectonic earthquake • epicentral distance 4441.38 km • Station Nečtiny NEC • station location 13.16864 E 49.97740 N • Seismometer Guralp 30 s
Kuril Islands • Date 2007 January 13 • Magnitude 8.2 • event location 154.80 E 46.18 N (Kuril Islands) • Depth 12 km • origin time 04:23:20.2 UTC • Source natural tectonic earthquake • epicentral distance 8607.75 km • Station Panská Ves PVCC • station location 14.5689 E 50.5282 N • Seismometer STS-2 120 s
Resultant shear velocity profiles Normal view log view