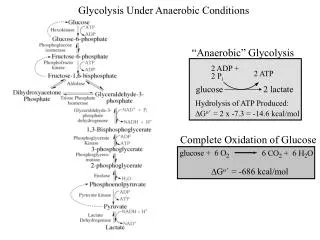
Download

1 / 22
220 likes | 361 Views
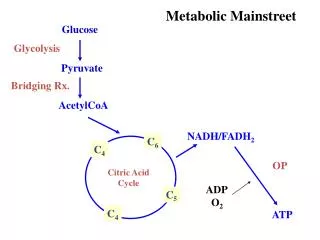
= S. KINETICS OF PASSIVE GLUCOSE TRANSPORT INTO (AND OUT OF) CELLS. S e (extracellular). Glucose (Inside). S i (Intracellular). k -1. k 1. Suspend cells in glucose solution for time t.

E N D
= S KINETICS OF PASSIVE GLUCOSE TRANSPORT INTO (AND OUT OF) CELLS Se (extracellular) Glucose (Inside) Si (Intracellular) k-1 k1 • Suspend cells in glucose solution for time t 2. Remove cells by centrifugation, wash with buffer, determine glucose inside using direct chemical analysis or 14C labeled glucose (“tracer”); repeat for multiple time points. Ve >>Vi , so Se constant, and Si (eqm) = Se
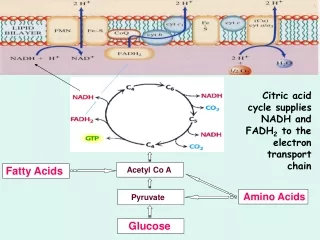
TRACER ANALYSIS OF GLUCOSE TRANSPORT 14 k* is the decay constant n is the number of 14C nuclei at any time dn/dt = disintegrations/sec (dps) t1/2 = 5,580 years = 1.76 x 10¹¹s k* = ln2/t1/2 = 3.9 x 10⁻¹² s-1 Suppose we have just 10-9 moles = 10-9 x 6 x 1023 = 6 x 10¹⁴ molecules Very small amounts of tracer are required! Usually added to a large excess of unlabeled substance.
GLUCOSE TRANSPORT IN THE ERYTHROCYTE “tracer” analysis with 14C glucose 1 Same total concentration of glucose f, fraction of equilibrium concentration inside chemical analysis of glucose Why is the tracer equilibration so fast compared with the chemical equilibration? Look at transport mechanisms for an explanation.
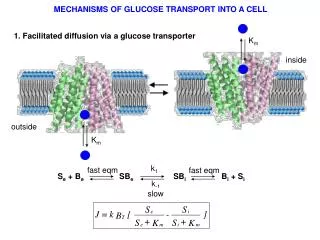
MECHANISMS OF GLUCOSE TRANSPORT INTO A CELL 1. Facilitated diffusion via a glucose transporter inside glucose outside
MECHANISMS OF GLUCOSE TRANSPORT INTO A CELL 2. Simple diffusion inside glucose outside
“flux” in molecules/cm2-s cm/sec EXPRESSING MEMBRANE TRANSPORT RATES A = area of membrane Ve S in molecules/cm3 k’ in s-1 Vi Si rate’ depends on volume and shape of the cell k Se rate independent of cell shape and volume; depends only on properties of the membrane
The simple diffusion mechanism 1. The transmembrane diffusion is rate-limiting (k1, k-1<< km, k-m) 2. The binding steps are in effective eqm (pre-equilibrium approximation) ni = number of molecules of S inside J = “flux” (molecules/cm2-s) A = membrane surface area (cm2) S in molecules/cm3 k1, k-1 in cm/sec
P = k1 = k-1 is the “permeability” (cm/sec) The transmembrane flux is just proportional to the gradient of concentration of S across the membrane, the “partition coefficient” Kb,and P, a property of the membrane interior.
k1 fast eqm fast eqm Se + Be SBe SBi Bi + Si k-1 slow facilitated diffusion mechanism Transporter; B is a binding site for glucose k1 = k-1 = k 1. Because binding sites on the transporter are confined to the surface, “concentrations” of transporter sites are in units of sites/cm2 (surface density). 2. k is then in s-1
k1 fast eqm fast eqm Se + Be SBe SBi Bi + Si k-1 slow Eliminate concentrations of intermediates (pre-equilibrium approx) Conservation of transporter sites on each surface; BTi and BTe are the total concentrations of binding sites at the respective surfaces Transporter sites randomly distributed between surfaces; BT is total conentration of sites at each surface. After a little algebra (done in appendix 1) Facilitated diffusion
Comparison of simple and facilitated diffusion in terms of initial rates simple facilitated Initial rates (Si = 0) Jmax = kBTwhen Se >> Km Initial rate behavior clearly distinguishes simple from facilitated diffusion mechanisms In terms of Jmax
THE EXPERIMENTAL RESULT WE ARE TRYING TO EXPLAIN “tracer” analysis with 14C glucose 1 f, fraction of equilibrium concentraiton inside chemical analysis of glucose To see if this behavior can be accounted for by either mechanism, we will express the rate equations in terms of f, the fraction of equilibrium concentration inside the cell (the y axis on the plot)
Express the flux in terms of f, the fractional approach to equilibrium (Se does not change much during approach to equilibrium) ne Define the fractional approach to equilibrium, f ni Vin Vout Vout >> Vin For simple diffusion Jmax is at f = 0 Jmax = PKbSe
Facilitated diffusion Divide numerator and denominator of flux equation by Se
facilitated diffusion Simple diffusion Relative flux at Km/Se = 0.1 (transporter sites saturated) Only halfway to equilibrium, the flux of the facilitated diffusion has dropped to 8% of its maximum value, while the simple diffusion continues at 50% of its maximum. Why is the facilitated process so slow here? f = Si/(Si)eqm
Se/Km This result can account for the anomalous rapid equilibration of “tracer” glucose while the chemical equilibration is slow. The tracer is in very low concentration, well below saturation. In this case, the efflux is not saturated, and much slower than the influx. Although the net flux is rather low due to low Se, it does not have far to go to reach equilibrium. This is most easily seen by determining the time dependence of f.
NUMERICAL SOLUTION TO THE FLUX EQUATION: time dependence of Si Vi = cell internal volume Si in molecules/cm3 Divide through by Se f = Si/Se Where r = radius of a spherical cell Can be solved numerically for f = f(t) for particular choices of Se, Km, r, BT, k
NUMERICAL SOLUTION TO THE FLUX EQUATION: time dependence of f Spherical cell of r = 5mm Km = 1x10⁻³ Molar k= 200 molecules s-1 3/r = A/V = 6 x 103 cm-1 BT = 1011 transporters cm2 (surface/volume of cell) Tracer experiment has very low effective Se! Even in the presence of a large excess of unlabeled glucose, the equilibration of tracer is fast. f = Si/Se = Si/(Si)eqm Chemical analysis experiment has high Se
Appendix 1. Derivation of the flux equation for facilitated diffusion Start with (1) Let ye and yi be the fractions of carrier sites at each surface that are complexed with S: (2) Where BTe and BTi are the total concentrations of binding sites at the external and internal surfaces, respectively, ie (3) Thus, (4) Now define the dissociation constant of S from the carrier as (5) On rearrangement (6)
Substitution of Be, Bi from (6) into (4) (7) Using (7) and (2) (8) Substituting (8) into (1) (9) If we assume that the binding sites on the transporter are randomly distributed between the two faces of the membrane (10) Finally, (9) and (10) give
Appendix 2. Concentration of radioactive glucose in a tracer experiment For 14C decay, 1Curie (Ci) = 3.7 x 10¹⁰ dps You can buy 14C glucose with 1mCi/mole “specific activity” Make a solution of 0.1 M 14C glucose In one liter, there are 0.1 Mole x 1mCi/mole = 0.1 mCi = 10-4 Ci of 14C glucose 10-4Ci x 3.7 x 1010 dps/Ci = 3.7 x 10⁶ dps n 1 x 10¹⁸ molecules of 14C glucose Moles of 14C glucose = 1 x 10¹⁸ / 6 x 1023 = 1.7 x 10⁻⁶ Therefore, the concentration of 14C glucose is only 1.7 x 10⁻⁶ Molar in the 0.1Molar glucose solution. The actual tracer concentration is very low.