Download

1 / 40
410 likes | 655 Views
Fine mapping of recombination in S. cerevisiae. Wolfgang Huber EMBL - EBI. Eugenio Mancera Ramos. Alessandro Brozzi. Richard Bourgon. Lars Steinmetz. EBI. EMBL HD. Meiotic Recombination. Proper chromosome segregation. Increase of genetic diversity. Gene A. Gene B. Gene C. Gene A.

E N D
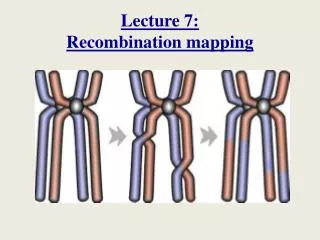
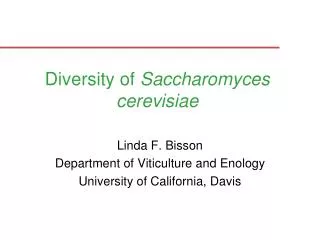
Fine mapping of recombination in S. cerevisiae Wolfgang Huber EMBL - EBI
Eugenio Mancera Ramos Alessandro Brozzi Richard Bourgon Lars Steinmetz EBI EMBL HD
Meiotic Recombination • Proper chromosome segregation • Increase of genetic diversity Gene A Gene B Gene C Gene A Gene b Gene c Gene a Gene b Gene c Gene a Gene B Gene C
second end capture dHJ noncrossover crossover DSBR Model of Recombination DSB strand degradation 3’ 3’ ends invade homolgous chromosome -> D loop D-loop
SDSA invading strand unwound 3d CO pathway nicked HJ crossover noncrossover Current Molecular Model of Recombination DSB strand resection 3’ 3’ single-end invasion D-loop DSBR second end capture dHJ crossover
Non-Random Distribution of Recombination Across the Genome female average male Human chr. 22q Yeast chr. 3 Petes T.D., 2001 Baudat F. & Nicolas A., 1997 Recombination hotspots are small genomic regions where recombination events cluster and that are surrounded by large stretches of recombinationally suppressed DNA
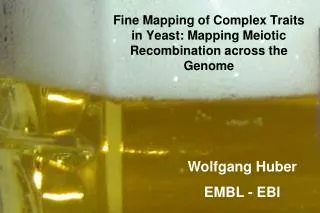
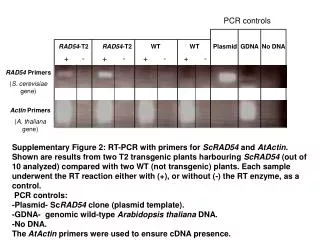
Map all recombination events that occurred in 50 yeast meioses using high-density tiling microarrays
Experimental Approach S96 YJM789 Diploid hybrid Meiosis Haploid spores
SNP Genome I A C G A T G Genome II A C G G T G Hybridization Genome II Hybridization Genome I C C A A C C C G G C G G C C C G C G C G G G C T T C C G G T T T A A A T A A A T A A T T A A A T G G G G A A A A T T T T C C C C G G G G T T T T Genotyping with Microarrays Perfect Match Mismatch
1 tiling array for 2 yeast genomes common S-specific Y-specific * 5’ 3’ Watson strand 8bp * 3’ 5’ Crick strand 4bp 25mer 10% 4% 86% S288c YJM789 291k 2,368k 108k (probes)
Single-reporter methods • De novo polymorphism detection • Winzeler et al.Science 281, 1998 (and others): ANOVA testing 1 = 1. • Borevitz et al.Genome Research 13, 2003: moderated t-test (SAM). • Brem et al. Science 296, 2002: moderated t-test, then cluster all data (parental and segregant) and discard SFPs for which clusters don’t separate the parental data. • Segregant genotyping (using polymorphims) • Use the estimated posterior probability of class membership (uniform prior on the classes): • Brem et al. augment this: are estimated from clustered data.
But we have multiple reporters per SNP: probe sets 6: CTTCACTATTTGTACAGATCGCAAT Probe sets: a set of reporters that exactly + uniquely map to a location and interrogate one polymorphism 5: CTAACTTCACTATTTGTACAGATCG 4: GGCCCTAACTTCACTATTTGTACAG 2: GACTGGCCCTAACTTCACTATTTGT 1: GGAGGACTGGCCCTAACTTCACTAT S96: CCTCCTGACCGGGATTGAAGTGATAAACATGTCTAGCGTTA YJM789: CCTCCTGACCGGGATTGAACTGATAAACATGTCTAGCGTTA 3: GACTGGCCCTAACTTGACTATTTGT
Multivariate analysis of probe set dataparallel coordinate plots log2 intensity reporters in probe set
Multivariate methods SNPScanner: Gresham et al., Science 311, 2006: • Model probe intensity xi with & without presence of SNP as function of • Probe GC content • Position of SNP within the probe • Nucleotides surrounding the SNP • Fit model parameters using two sequenced strains with known SNPs. • To genotype a segregant or new strain at a given base, compute a likelihood ratio assumption: covariance matrix diagonal and same
Genotyping by Semi-Supervised Clustering (GTS) neighbouring probes' data are not independent variances for the two genotypes are often quite different training data is often not representative likelihood ratio test generates too many wrong calls we needed a generalized multi-probe method: EM-algorithm applied to a multivariate Normal mixture model
Examples of semi-supervised clustering of probe set data (first 2 PCA components)
Benchmark SNPScanner - GTS • 233 Affymetrix yeast tiling arrays from Steinmetz group: 13 S288, 12 YJM789: training data 52 tetrads of crosses: to be genotyped • Same post-processing/filter
GTS calls arrays genomic position (markers)
Segregation of 50,000 Markers in a Tetrad 16 15 14 13 12 11 10 9 8 7 6 5 4 3 2 1 Chromosomes YJM789 S288c Marker genotypes along chromosome
Three adjacent cross-overs involving three chromosomes chr 1, wt_47
A cross-over plus two long conversions, involving all four chromosomes chr 3, wt_19
Three adjacent conversions involving three chromosomes chr 3, wt_38
Cross-over accompanied by multiple conversions chr 4, wt_36
General characteristics Crossover Conversion 1.8% - 4.5% of genome is part of recombination events in a single meiosis (up to 544 Kb) Every chromosome had at least one crossover event
crossover conversion HIS4 HIS2
Implications of A Conversion Hotspot:Non-monotonous relationship between genetic and physical map Genetic Distance Physical Distance Linked! unlinked At a conversion hotspot proximal markers have greater genetic distance than distal markers conversion hotspot (HIS2)
%DSB DSBs Map Baudat F. & Nicolas A., 1997 SGD Map cM/Kbp Kbp www.yeastgenome.org Comparison of Recombination Maps crossover conversion Our Maps count
Interference Zki8 Spo11 Spo11 Zki8 Zip4 Zip2 Zip3 Rad50 Mre11 Xrs2 Zip1 Zip1 Dmc1/Rad51 Mer3 SDSA DSBR Msh4/Msh5 Mus81 Mms4 Mlh1 Mlh3 crossover crossover noncrossover
Next Crossover vs. conversion hotspots Sequence characteristics of hotspots Interference Correlation of hotspots with sequence variants Is recombination mutagenic?
EBI Elin Axelsson Richard Bourgon Alessandro Brozzi Ligia Bras Tony Chiang Audrey Kauffmann Gregoire Pau Oleg Sklyar Mike Smith Jörn Tödling David Zhang Michael Boutros DKFZ Heidelberg Stefan Wiemann DKFZ Heidelberg Jan Ellenberg EMBL HD Robert Gentleman FHCRC Seattle EMBL Lars Steinmetz Eugenio Mancera Zhenyu Xu Julien Gagneur Steve Oliver U Cambridge Amy Kiger UCSD Alvis Brazma EBI The contributors to R and Bioconductor projects
Properties of Hotspots More non-crossovers than crossovers 4-15:1 Petes T.D., 2001 • Hotspots interact among each other (crossover interference) • Hotspots seem to be short lived in evolutionary scale