Download
1 / 1
10 likes | 193 Views
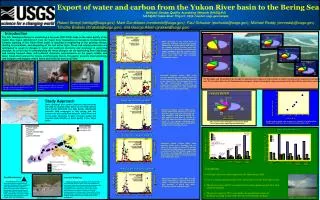
Carbon Flux, Water Year 2002. WATER DISCHARGE. Intensive Sampling. DISSOLVED INORGANIC CARBON. Fixed Station Network. YUKON RIVER AT EAGLE. Carbon Yield, Water Year 2002. PARTICULATE INORGANIC CARBON. PARTICULATE ORGANIC CARBON. YUKON RIVER. June & Aug-Sept., 2002. Yukon R. at Eagle.

E N D
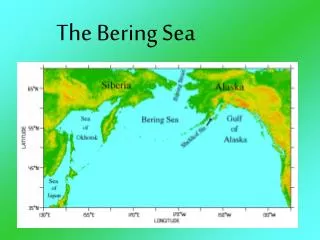
Carbon Flux, Water Year 2002 WATER DISCHARGE Intensive Sampling DISSOLVED INORGANIC CARBON Fixed Station Network YUKON RIVER AT EAGLE Carbon Yield, Water Year 2002 PARTICULATE INORGANIC CARBON PARTICULATE ORGANIC CARBON YUKON RIVER June & Aug-Sept., 2002 Yukon R. at Eagle POC 7/1/02 7/1/01 7/1/01 5 7/1/02 Porcupine R. 6.55 Tg C 188 km3 1,000,000 11% June & Aug-Sept., 2003 30,000 3.0 35 7/1/01 7/1/02 0.6 DIC Yukon R. near Stevens Village 7/1/02 7/1/01 Yukon River: 0.7 4.5 Eagle Yukon River: Yukon River: Yukon River: Yukon River: DOC Eagle Eagle Eagle Eagle 1.2 16 DIC 900,000 PIC Tanana R. 8 Stevens 21% Stevens Stevens Stevens Stevens 30 PIC To atmosphere 4 Yukon R. at Pilot Station DOC 2.5 25,000 DIC Pilot Station 0.5 0.6 Pilot Station Pilot Station Pilot Station Pilot Station 800,000 14 DOC 7 57% Porcupine River POC PIC 1.0 3.5 POC CO2 Porcupine River Porcupine River Porcupine River Porcupine River Porcupine River 11% 25 700,000 YUKON RIVER AT STEVENS VILLAGE Total C (Tg C) Total Water Discharge (km3) 0.5 6 12 0.4 2.0 20,000 Tanana River 3 15% Tanana River Tanana River Tanana River Tanana River Stevens Village 109 grams PIC d-1 Fort Yukon Koyukuk River 3.63 Tg C 104 km3 109 moles PIC d-1 POC 600,000 0.8 109 grams DIC d-1 Flux (g C yr-1 x 10¹²) 109 grams POC d-1 109 moles DIC d-1 POC 5 20 Discharge (m3 sec-1) 109 moles POC d-1 Discharge (ft3 sec-1) River 2.5 0.4 10 8% C Yield per watershed area (moles C m-2 yr-1) 0.3 DOC 6% 1.5 500,000 15,000 Yukon 2.63 Tg C 76 km3 4 2 20% Tanana River 0.6 8 0.3 15 Eagle 400,000 40 1.5 0.2 3 DIC DIC 1.0 PIC 10,000 6 DOC 35 0.2 300,000 62% 0.79 Tg C 24 km3 10 10% 1 0.4 56% 2 YUKON RIVER AT PILOT 0.36 Tg C 12 km3 17% 30 Pilot Station 0.1 STATION 4 200,000 0.5 0.1 0.5 POC 5000 25 1 5 Whitehorse PIC Major Drainage Basins 0.2 7% 100,000 0 20 2 DOC 0 Porcupine River Tanana River Yukon River at Eagle Yukon River at Stevens Village Yukon River at Pilot Station 6% Annual water yield (cm yr-1) 0 0.0 Upper Yukon R. & Headwaters Porcupine River Tanana River Yukon River at Eagle Yukon River at Stevens Village Yukon River at Pilot Station 21% 15 0.0 0 Porcupine R. 0 0 3/1/01 6/1/01 9/1/01 12/1/01 3/1/02 6/1/02 9/1/02 0 0.0 Tanana R. 9/1/02 3/1/01 6/1/01 9/1/01 12/1/01 3/1/02 6/1/02 3/1/01 6/1/01 9/1/01 12/1/01 3/1/02 6/1/02 9/1/02 CO2 = 1.2 Tg C Total = 7.75 Tg C 10 East Central Yukon R. 3/1/01 6/1/01 9/1/01 12/1/01 3/1/02 6/1/02 9/1/02 0 0.25 0.5 0.75 1 1.25 PIC Koyukuk R. & West, Lower Yukon R. DIC 7% moles C m-2 yr-1 65% DISSOLVED ORGANIC CARBON 7/1/01 7/1/02 3.0 35 30 2.5 25 2.0 109 grams DOC d-1 20 109 moles DOC d-1 1.5 15 1.0 10 0.5 5 0.0 0 3/1/01 6/1/01 9/1/01 12/1/01 3/1/02 6/1/02 9/1/02 Export of water and carbon from the Yukon River basin to the Bering Sea Robert Striegl (rstriegl@usgs.gov), Mark Dornblaser (mmdornbl@usgs.gov), Paul Schuster (pschuste@usgs.gov), Michael Reddy (mmreddy@usgs.gov) Timothy Brabets (tbrabets@usgs.gov), and George Aiken (graiken@usgs.gov) National Stream Quality Accounting Network (NASQAN) NASQAN Yukon River Project: http://water.usgs.gov/nasqan Introduction The U.S. Geological Survey is conducting a five-year (2001-2005) study of the water quality of the Yukon River basin (855,000 km2) from the Yukon River headwaters in Canada to the Bering Sea. Climatic warming of the Yukon River basin is resulting in lengthening of the growing season, melting of permafrost, and deepening of the soil active layer.These and related processes are anticipated to result in changes in water and sediment chemistry and discharge in upcoming decades. As a first step in understanding the these changes, we are monitoring water discharge and making frequent water and sediment chemistry measurements on the upper, middle, and lower Yukon River and on the Tanana and Porcupine Rivers. This poster presents water discharge and inorganic and organic carbon fluxes and yields for water year 2002. Water discharge in the Yukon River is typified by snowmelt runoff in early spring, followed by sustained glacial melt water in late summer, tapering to winter base flow. Porcupine River discharge is dominated by spring snowmelt and late summer rains, while the Tanana River receives sustained glacial melt water and lake overflows through late summer. Dissolved inorganic carbon (DIC) loads increase dramatically with spring runoff and are maintained at high levels through summer in the Yukon River. The Porcupine River has low DIC concentrations. Dissolution of carbonate-rich suspended sediment in glacial melt water contributes to a late summer DIC peak in the Tanana River (Eberl 2004). The Porcupine and Tanana Rivers are thought to represent end members of relative fluxes of carbon constituents for sub-basins dominated by wetland and glacial melt water inputs. Over half of the carbon flux from the Porcupine basin is organic carbon, while over 70% of carbon flux from the Tanana basin is inorganic carbon. Intermediate values are present in the Yukon River, with relative contributions of POC decreasing slightly and relative contributions of DIC increasing slightly from up-river to down-river. The flux of carbon dioxide from the Nulato River is measured using a floating chamber and an Infrared Gas Analyzer Sampling the Yukon River for dissolved greenhouse gases; carbon dioxide and methane American Creek, Alaska, a tributary of the Yukon River discharges high DOC water to the Yukon River during spring melt Study Approach Water discharge and carbon chemistry measurements are used to calculate mass fluxes at five fixed stations sites during 2001-2005 (see map below). Boat-based intensive field campaigns in late spring and late summer are also conducted along the Yukon River and on its major tributaries to gain a broader spatial and temporal understanding of water quality in the Yukon basin. Dissolved inorganic carbon (DOC) loads closely follow water discharge. In each of the rivers, DOC loads were low during low flow conditions and greatest during the lead portion of peak flow. In contrast to DIC, DOC loads decreased after snowmelt runoff in the spring, indicating that different watershed processes control DOC and DIC in the Yukon River basin. Annual carbon yields were as great as 1.0 mole C m2 of watershed. Total carbon yield was very closely correlated with runoff. CO2 evasion to the atmosphere accounts for about 15% of total carbon export by the Yukon River. Particulate organic carbon (POC) loads generally follow water discharge and are similar in most instances to the DIC profiles. The fact that the DOC profiles are not strongly correlated with the POC profiles suggest that the factors controlling POC and DOC source and transport are different among watersheds in the Yukon River basin. Conclusions: • Over half of the total carbon export from the Yukon basin is DIC. • CO2 is a significant portion of the total carbon export from the Yukon River basin. • The greatest export of DOC is correlated to the leading portion of peak flow from • snowmelt discharge. • The greatest export of PIC is correlated to the glacial melt water peak • discharge occurring several weeks after the snowmelt peak discharge. Fixed Site Network: Baseline data The five fixed stations represent areas of extensive permafrost and wetlands (Porcupine River), sediment laden glacial melt water (Tanana River), the Yukon River headwaters upstream of Alaska (Yukon River at Eagle), the Yukon river below Yukon Flats (Yukon River at Stevens Village) and the Yukon River near its mouth (Yukon River at Pilot Station). Intensive Sampling: Process-based data intensive boat-based sampling of the Yukon River is conducted twice per year, once near peak flow in early June and once near base flow in late August and early September. The entire Yukon River will be sampled by this method over a three year period. Data from these intensive samplings increase understanding of carbon source areas, within stream dissolution of suspended carbonates, metabolism of organic carbon, and the flux carbon gases to the atmosphere. Particulate inorganic carbon (PIC) strongly reflects the influence of glacial melt water inputs. The greatest PIC loads correlate with increases in glacial melt water discharge; not with snowmelt runoff. Sampling the Tanana River Rainbow over the Yukon River, August, 2003 Sampling the Tanana River