Download

1 / 14
140 likes | 292 Views
Transcription factor profiling in individual hematopoietic progenitors by digital RT-PCR. Luigi Warren, David Bryder , Irving L. Weissman , and Stephen R. Quake. Background. Stem cell differentiation Chemical state machine

E N D
Transcription factor profiling in individual hematopoietic progenitors by digital RT-PCR Luigi Warren, David Bryder, Irving L. Weissman, and Stephen R. Quake
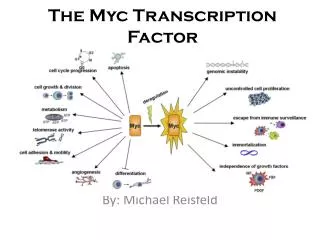
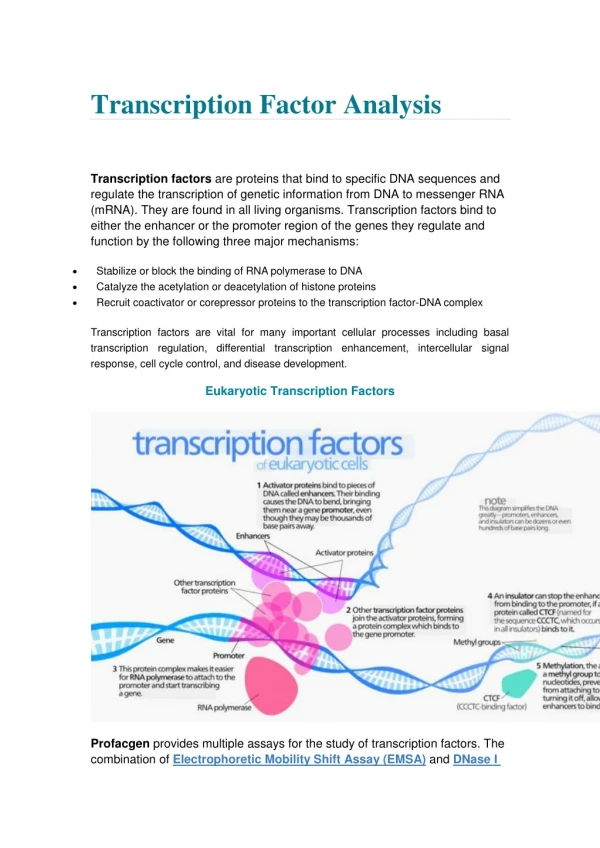
Background • Stem cell differentiation • Chemical state machine • Sequencing logic implemented by cross-regulating transcription factors • State of the network realized in the abundance profile of these regulatory molecules • Transitions between states • Instability, stochastic fluctuation, external signals • Transcription factor PU.1 • Cytokine receptor flk2 • Housekeeping transcript GAPDH
Goals • Understand the behavior of transcriptional regulatory network for stem cell differentiation • Leads to understanding of development • Requires the ability to characterize network states quantitatively
Problems • Network states cannot be characterized quantitatively • Current gene profiling methods not sensitive enough • Conventional gene expression assays • Stem cells not easily isolated in such quantities • Require thousands of cells’ worth of RNA as analyte • Population-average expression data provide an incomplete picture • Variations in network state determined by just a few phenotypic differences between cell types
Conventional PCR • Quantitation based on number of cycles required for dye fluorescence to reach given threshold • Exponential nature magnifies slight variations in amplification efficiency • Interassay comparisons only valid if gene-of-interest measurements are normalized to measurements on endogenous controls or synthetic standards
Solution • Digital RT-PCR • Partition individual cDNA molecules into discrete reaction chambers before PCR amplification • Quantitation uses binary, positive/negative calls for each subreaction within partitioned analyte • Flow Cytometry • Reveals diversity in patterns of surface protein expression within populations of superficially similar cells
FACS • Fractionation of CMP cells into flk2+ and flk2- subsets
Digital Array Chip • cDNA from individual HSCs • Green: GAPDH • Red: PU.1 • Each well captures ~0 or 1 template molecules
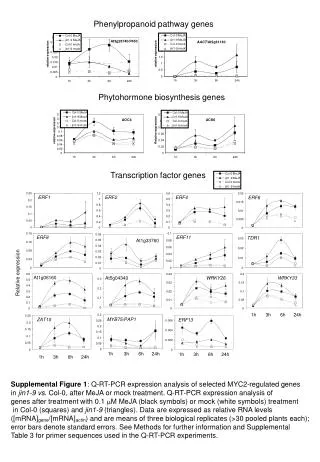
Results • Number of individual cells expressing PU.1 • PU.1 expression up-regulated in CMP/flk2+ • Down-regulated in CMP/flk2- cells and MEPs • Higher GAPDH expression in CMPflk2+cells.
Further Optimizations • Threshold values • Reference endogenous controls • Weighted normalization of data • mRNA vs protein turnover rate • Measurement noise
Future Application • Gene expression measurements can be made on an absolute, copy-number-per-cell basis • Sophisticated regulatory network analysis • Spread of public databases cataloguing cell-type-specific expression data • Refinement of taxonomies through single-cell survey approach
Thank you • Questions?