Download
1 / 24
240 likes | 461 Views
By Krishnashish bose Current supervisor: Assoc Prof. Dr. Anh Tuan Phan Previous supervisors: Prof. Dr. Bodh Raj Mehta & Assoc Prof. Dr. Bishwajit Kundu. Biomolecular Studies using Scanning Probe Microscopy. Contents.

E N D
By Krishnashishbose Current supervisor: Assoc Prof. Dr. Anh Tuan Phan Previous supervisors: Prof. Dr. Bodh Raj Mehta & Assoc Prof. Dr. BishwajitKundu Biomolecular Studies using Scanning Probe Microscopy
Contents I shall be briefly discussing the research that I have done during my M.Sc in Physics at IIT Delhi. I shall start with a brief introduction to AFM and its potential applications. This presentation consists of 24 slides (mostly images) and would be for about 20 minutes.
To see is to believeTo see the processes at the molecular level happening inside the living cell is the one of the greatest challenges. It is easier to look at a star thousands of light years away, than to look at a molecule inside our own cells.
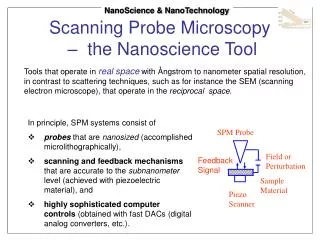
SPM: Introduction • SPM stands for Scanning Probe Microscope. It is a broad class of microscopes that use a very sharp tip to interact locally with the sample. • AFM is the successor of the Scanning Tunneling Microscope (STM), developed in the 1980s by Binning et al. • STM exploits the principle of tunnelling of electrons across a barrier with a difference in density of states of electrons. It is the highest resolution non-destructive microscopy technique. • AFM measures directly the tip-sample interaction forces , hence the name Force Microscopy.
Basic design of an AFM. Design of a small sample AFM Design of a large sample AFM The small sample AFM usually has better signal to noise ratio for scan sizes below 500 nm. Picture taken from Pg 10 of BhartBhusan’s book : Nanotribology and Nanomechanics, 2nd edition, Springer.
Why Scanning Probe Techniques? • The only non-destructive approach to reach atomic resolution. Electron Microscopes of similar resolution burn (radiation damage) the sample. • The only technique offering true height resolution of less than 1 nm. • Not only can you see single molecules, but also play with it to extract so much information that we are yet to explore. • Scanning Probe Microscopy is a vast field and is still growing rapidly. It can offer the best solutions in the world of quantum mechanics. Even a quantum computer (which according to me is the greatest invention of the century) would use a Magnetic Resonance Force Microscope to read qubits. • Techniques like NSOM capture photons at very low cross-sections, thus offering sub-wavelength optical microscopy and Raman spectroscopy.
Images of Beta AmyloidNanofibers Images taken by me
Images of α-Synuclein and GelsolinamyloidNanofiber Images taken by me
Imaged in tapping mode using FESP probe having cantilever stiffness of 1.6 N/m and a tip-end diameter of 10 nm (measured using SEM). Notice that the Prion fibrils have just been resolved at a separation of 10 nm (see Section Analysis curve). In the section analysis, it shows that the protofibrils are both of width 4 nm, but the height analysis gives 3.5 nm and 2.5 nm. This is because for lateral widths less than the tip diameter, the Nanoscope software cannot give the true value.
Sapphire Mica Images taken by me
DMT modulus image obtained (top right) of the Lysozymeoligomers (top left). Section Analysis (below) gives a DMT modulus of 3.3 GPa
PeakForce QNM mode a) Images taken from Bruker manual
Reduced Stiffness • In general, D = Zp + Zc + δ , whereZc and δ are the deformations of cantilever and sample respectively, D is thedistance between the tip and the sample and Zp is the distance moved by the piezo in the z-direction. • In the contact regime, D = 0 => Zp = -(Zc + δ) . • Comparing with two springs of stiffness kc (cantilever) and ks (sample) connected in series in equilibrium, the effective stiffness (keff) is given by => (1) • If the sample is much stiffer than the cantilever, then keff ≈ kc which shows that the force curve is primarily due to the stiffness of the cantilever, and not that of the sample. • There is a restraint even on the young's modulus of the tip.
The stiffness of the sample is related to its Young'smodulus by ks = 1.5 aEtot ; where a is the tip-samplecontact radius, Etot is the reduced Young's modulus for perfectly elastic solids, given by Stiffness and Young's Modulus (2) If the tip deformation is neglected, then (3) Therefore, ks = (4) which gives, (5) H.J.Butt, B.Cappella, M.Kappl; “Force measurements with the atomic force microscope: Technique, interpretation and applications”. Elsevier Surface Science Reports 59 (2005).
The first paper on Nanoindentation was published in 1882 by the great physicist Prof. Heinrich Rudolf Hertz. Hertz theory can only be applied when the adhesion force is much smaller than the maximum load. In this model, following relations have been established: The Hertz Model (6) (7) a = Tip-Sample contact radius R = Effective tip radius of curvature = F = Force exerted by tip on sample Etot = Reduced Young's modulus σt = Poisson's ratio of tip δ = Indentation = d (in figure) (8)
This model was forwarded in 1974 by Derjaguin, Muller and Toporov. This model considers adhesion just outside the area of contact of the tip and sample. In this model, following relations have been established: The DMT model (9) (10) a = Tip-Sample contact radius R = Effective tip radius of curvature δ = Indentation F = Force exerted by tip on sample Etot = Reduced Young's modulus W = Work of adhesion per unit area
My results and conclusion • The DMT modulus of Prion & Gelsolinamyloids were found for the first time. • The DMT modulus of Lysozyme fibrils agreed well with the reported value. • The DMT modulus of amyloids in oligomeric stage and pre-fibrillary stage were found for the first time. • Amyloids responsible for more probable diseases show high elastic modulus. • As the amyloids keep maturing, their elastic modulus decreases.
Significance of Elastic Modulus of AmyloidNanofibers • The elastic modulus is a fundamental property of matter that owes its origin to a molecule's restraint to deformation. • It gives clue about the molecular packing density and structural rigidity. Using this, it is possible to characterize different materials based only on their elastic modulus. • A 'normal' protein and an amyloid forming protein could be distinguished just by their elastic modulus values. This can help in early detection of diseases marked by amyloid formation. • It is also possible to monitor the effect of external agents on the mechanical strength of amyloids, which would help in finding better cure for diseases caused by amyloids.
STM images of DNA Source: J. Vac. Sci. Technol. B 9, 1306 (1991) Source: Biochemical and Biophysical Research Communications 303 (2003) 154
Single actin filaments scanned in liquid with monomer (4 nm) resolution. (Schmitz et al. 2010). An actin filament simultaneously imaged with total internal reflection fluorescence microscopy and AFM. (Schaap 2006). Microtubule imaged with AFM in liquid. Single protofilaments are visible (Schaap et al. 2004). Microtubule decorated with kinesin motors in presence of AMP-PNP. The motors are visible as blobs on the microtubule. (Schaap et al. 2007).
Dynamic Images captured by AFM Single kinesin motor moving along the microtubule at 1 µM ATP. Both heads of the motor are clearly visible (Schaap et al. 2011) Dynamics of DNA loosely bound to a mica surface (Sebastian Hanke 2011). Two single kinesin motors moving along a single protofilament (Schaap et al. 2011).
Hurdles for reaching ultimate resolution The height & lateral resolution of the best AFMs in the world is 0.1 nm & 0.5 nm, but on non-deformable samples. The tip-sample contact area limits the lateral resolution. Low stiffness cantilevers are prone to noise. It can be taken care of by increasing AFM stability. Fabrication of sharp tips is a great technological challenge. The sharpest tip available has an end-radius of 1 nm. Tip shape is also a big issue, depending on your sample topography.