Download
1 / 21
210 likes | 364 Views
objectives. ...to contribute to the air quality evaluation , according to the AQ Framework Directive. ...to verify the fulfilment of the Daughter Directives for NO 2 , SO 2 , CO and specially O 3. methodology... model system. meteorology. ECMWF

E N D
objectives... ...to contribute to the air quality evaluation, according to the AQ Framework Directive ...to verify the fulfilment of the Daughter Directives for NO2, SO2, CO and specially O3
methodology...model system meteorology ECMWF (European Centre for Medium-range Weather Prediction) 3D fields Wind Temperature Specific humidity 2D fields Superficial pressure Cloud cover Precipitation photochemistry CHIMERE gas-phase 2D fields Pollutants deposition 3D fields Pollutants concentration O3, NO2, NO, CO, COV, SO2
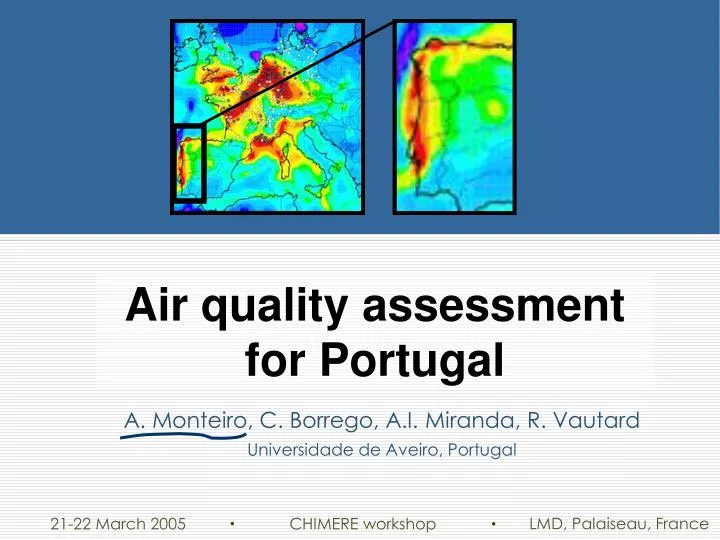
50x50 km methodology...study domain 1asimulation at continental scale 57.5N simulation period 2001 Initial and background conditions MOZART climatological model emissions EMEP inventory vertical structure 6 levels (50, 250, 600, 1200, 2000 e 3000 m) 35N 10.5W 22.5E
methodology...study domain 2asimulation nested to PORTUGAL domain “simple one-way technique”
10x10 km methodology...study domain 2a simulation nested to PORTUGAL domain Initial and background conditions simulated outputs 50x50 km 580 km emissions “top-down” methodology (VII CNA: Monteiro et al, 2001) 290 km
Parameters Period Human health protection Hourly average 350 24 times/year 1 Jan 2005 Human health protection Daily average 125 3 times/year 1 Jan 2005 Vegetation protection Anual average 20 - - Vegetation protection Winter average 20 - - Human health protection Hourly average 200 18 times/year 1 Jan 2010 Human health protection Anual average 40 - 1 Jan 2010 Human health protection 8h running average 10 mg.m-3 - 1 Jan 2005 Human health protection (target value) 8h running average 120 25 times/year 1 Jan 2010 Vegetation protection (AOT40) (target value) Hourly average (May-July) 18000 µg.m-3.h - 1 Jan 2010 Information threshold hourly average 180 - - Alert threshold Hourly average 240 3 consecutive h - air quality assessment AQ standart (µg.m-3) Nº of allowed excedeences Target date SO2 (1999/30/EC) NO2(1999/30/EC) CO (2000/69/EC) O3(2002/3/EC)
air quality assessment...2001! human health protection SO2 limite value Porto limite value Lisbon
air quality assessment...2001! human health protection NO2 limite value limite value
air quality assessment...2001! human health protection CO
air quality assessment...2001! human health protection O3 limite value
AOT exceedances air quality assessment...2001! vegetation protection O3 VALOR-ALVO PROTECÇÃO VEGETAÇÃO OBJECTIVO LONGO-PRAZO PROTECÇÃO VEGETAÇÃO
validation exercise Air Quality National network • 23 background stations • industrial stations 5 • traffic stations 17 45
Parameters Error Human health protection (hourly limit value) 0,34 Human health protection(daily limit value) 0,57 Vegetation protection (annual limit value) 0,43 Vegetation protection (winter limit value) 0,54 Human health protection (hourly limit value) 0,48 Human health protection (annual limit value) 0,50 Human health protection (daily 8h limit value) 0,32 Human health protection (daily 8h limit value) 0,16 Vegetation protection (AOT40) 0,59 (annual average) 0,40 validation exercise...quantitatively Polutant SO2 NO2 CO O3
TYPE O3 NO2 SO2 RMSE (µg.m-3) r bias RMSE (µg.m-3) r RMSE (µg.m-3) r AVA 18.46 0,78 -5,04 21,71 0,59 24,55 0,48 MVE 19.00 0,66 -3,56 9,36 0,53 33,12 0,49 LOU 19.93 0,85 -6,99 29,20 0,68 30,43 0,59 PP 20.10 0,80 -2,86 35,26 0,59 37,65 0,40 BEA 21.95 0,73 -9,22 33,85 0,49 32,65 0,53 REB 22.16 0,71 -4,23 33,50 0,63 25,51 0,66 ALF 22.41 0,65 10,38 30,39 0,53 33,50 0,47 LEC 22.55 0,73 -13,25 32,16 0,62 29,98 0,56 ERM 22.83 0,78 -10,41 32,85 0,58 26,24 0,61 34 0.4 -7.8 33 0.4 22 0.7 LAR 22.85 0,77 -10,10 35,88 0,64 32,62 0,54 validation exercise...quantitatively STATION Background Background Background Background Background Background Background Background Background Background average VNT Background 25.50 0,64 -11,66 34,34 0,63 32,25 0,53
validation exercise...quantitatively simulated background observed good agreement industrial overestimation O3 (µg.m-3) traffic overestimation
validation exercise...quanlitatively NO2 O3 measured measured modelled modelled Experimental campaigns with difusion tubes
V 200303 V 200410 ECMWF MM5 MM5 ECMWF sensitivity tests...
future work... • operational air quality forecast for Portugal 10x10 km with zoom to Lisbon and Porto area • aerosols version simulation • forest fire emissions estimation and its integration in the forecast air quality system • ...