Download
1 / 4
40 likes | 121 Views
Explore preservation of purchasing power, capital, risks, and performance periods in equity and bills investments with global returns data. Past performance insights for informed decisions.

E N D
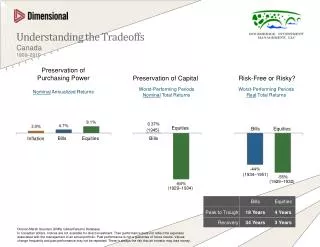
Understanding the TradeoffsCanada1900–2010 Preservation of Purchasing Power Preservation of Capital Risk-Free or Risky? Worst-Performing Periods Nominal Total Returns Worst-Performing Periods Real Total Returns Nominal Annualized Returns Equities Bills Equities (1945) Equities Bills Bills Inflation (1934–1951) (1929–1932) (1929–1934) Dimson Marsh Staunton (DMS) Global Returns Database. In Canadian dollars. Indices are not available for direct investment. Their performance does not reflect the expenses associated with the management of an actual portfolio. Past performance is not a guarantee of future results. Values change frequently and past performance may not be repeated. There is always the risk that an investor may lose money.
Understanding the TradeoffsAustralia1900–2010 Preservation of Purchasing Power Preservation of Capital Risk-Free or Risky? Worst-Performing Periods Nominal Total Returns Worst-Performing Periods Real Total Returns Nominal Annualized Returns Bills Equities Equities (1950) Bills Equities Bills Inflation (1970–1974) (1937–1977) (1970–1974) Dimson Marsh Staunton (DMS) Global Returns Database. In Australian dollars. Indices are not available for direct investment. Their performance does not reflect the expenses associated with the management of an actual portfolio. Past performance is not a guarantee of future results. Values change frequently and past performance may not be repeated. There is always the risk that an investor may lose money.
Understanding the TradeoffsUS1900–2010 Preservation of Purchasing Power Preservation of Capital Risk-Free or Risky? Worst-Performing Periods Nominal Total Returns Worst-Performing Periods Real Total Returns Nominal Annualized Returns Bills Equities Bills Equities Equities Bills Inflation -0.02% (1938) (1933–1951) (1929–1931) (1929–1932) Dimson Marsh Staunton (DMS) Global Returns Database. In US dollars. Indices are not available for direct investment. Their performance does not reflect the expenses associated with the management of an actual portfolio. Past performance is not a guarantee of future results. Values change frequently and past performance may not be repeated. There is always the risk that an investor may lose money.
Understanding the TradeoffsUK1900–2010 Preservation of Purchasing Power Preservation of Capital Risk-Free or Risky? Worst-Performing Periods Nominal Total Returns Worst-Performing Periods Real Total Returns Nominal Annualized Returns Bills Equities Equities (1935) Equities Bills Inflation Bills (1914–1920) (1973–1974) (1973–1974) Dimson Marsh Staunton (DMS) Global Returns Database. In British pounds. Indices are not available for direct investment. Their performance does not reflect the expenses associated with the management of an actual portfolio. Past performance is not a guarantee of future results. Values change frequently and past performance may not be repeated. There is always the risk that an investor may lose money.