Download

1 / 30
300 likes | 597 Views
Overview. BackgroundCurrent ProcessDataMy ToolsetAnticipated ResultsChallengesOpportunities. . . Background. California has devastating wildfires every yearOf the 4.8 million acres burned this year so far, 1.26 million are in California20 million acres of National Forest in California

E N D
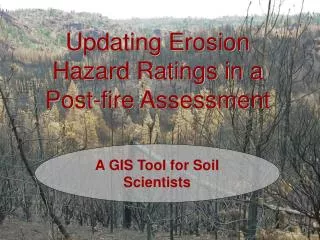
1. Updating Erosion Hazard Ratings in a Post-fire Assessment A GIS Tool for Soil Scientists Hello and thank you. My name is Jonna Cooper and I work for the U.S. Forest Service at the Shasta-Trinity National Forest in northern California. I am a soil scientist by education but my primary job is currently in GIS. I tried to take advantage of both of those backgrounds in creating my capstone project.
My proposal is to create a couple of tools that soil scientists can use to quickly assess erosion hazard after a wildfire.Hello and thank you. My name is Jonna Cooper and I work for the U.S. Forest Service at the Shasta-Trinity National Forest in northern California. I am a soil scientist by education but my primary job is currently in GIS. I tried to take advantage of both of those backgrounds in creating my capstone project.
My proposal is to create a couple of tools that soil scientists can use to quickly assess erosion hazard after a wildfire.
2. Overview Background
Current Process
Data
My Toolset
Anticipated Results
Challenges
Opportunities I�ll start by giving an overview of my presentation tonight.
First, I�ll give a little background on when and why soils specialists assess erosion hazard after wildfires and why a series of tools might facilitate the process
Next, I�ll show how the process currently works and how I hope to improve it. This will also include a look at the data that is readily available and some of the challenges it presents.
Though I�ve not actually created my set of tools yet, I�d like to present my concept of what they will do and how they will work which will lead into my anticipated results.
Finally, I will present some of the challenges I am facing and foreseeable opportunities to build on the outcome.
With that, let�s get started.I�ll start by giving an overview of my presentation tonight.
First, I�ll give a little background on when and why soils specialists assess erosion hazard after wildfires and why a series of tools might facilitate the process
Next, I�ll show how the process currently works and how I hope to improve it. This will also include a look at the data that is readily available and some of the challenges it presents.
Though I�ve not actually created my set of tools yet, I�d like to present my concept of what they will do and how they will work which will lead into my anticipated results.
Finally, I will present some of the challenges I am facing and foreseeable opportunities to build on the outcome.
With that, let�s get started.
3. Background California has devastating wildfires every year
Of the 4.8 million acres burned this year so far, 1.26 million are in California
20 million acres of National Forest in California � 800,000 acres burned in 2008
High vulnerability due to Mediterranean climate
Dry summers followed by wet winters
Summer lightning storms with little or no rain As you may have heard, we�ve had a few fires out here this summer. Though my Forest has been especially hard hit, these kinds of fires occur every year. (read current numbers from first bullet).
One of the reasons California is beset by wildfires is a combination of the sheer number of vulnerable acres ( a lot of public wildland) we have and the Mediterranean climate. This characterized by dry summers and wet winters.As you may have heard, we�ve had a few fires out here this summer. Though my Forest has been especially hard hit, these kinds of fires occur every year. (read current numbers from first bullet).
One of the reasons California is beset by wildfires is a combination of the sheer number of vulnerable acres ( a lot of public wildland) we have and the Mediterranean climate. This characterized by dry summers and wet winters.
4. Many communities adjacent to forests (WUI � Wildland-Urban Interface)
Fire is often just the beginning of concerns
Additionally, because we have many communities in and around our Forests (known as WUIs or Wildland-Urban Interfaces), the concerns don�t end when the fire is put out. As I mentioned in the previous slide, the winter rains follow the summer fires and erosion and mudslides become a concern.Additionally, because we have many communities in and around our Forests (known as WUIs or Wildland-Urban Interfaces), the concerns don�t end when the fire is put out. As I mentioned in the previous slide, the winter rains follow the summer fires and erosion and mudslides become a concern.
5. We know that fires damage property. Vehicles and homes are lost every year in wildfires.
(Click) Fires also damage the health of watersheds and the ecosystems contained within them. Runoff increases stream flow and overwhelms channels. Sediment damages fish habitat. Landslides increase.
(click) But fires can also lead to loss of life. Not just from the fires themselves but from the subsequent mudslides. in southern CA in 2003 several mudslides caused untold damage, including the deaths of 16 people on Christmas day when a mudslide in the San Bernardino NF tore through a church camp where several families had gathered to celebrate. This photo is of Cable Canyon in S. California.We know that fires damage property. Vehicles and homes are lost every year in wildfires.
(Click) Fires also damage the health of watersheds and the ecosystems contained within them. Runoff increases stream flow and overwhelms channels. Sediment damages fish habitat. Landslides increase.
(click) But fires can also lead to loss of life. Not just from the fires themselves but from the subsequent mudslides. in southern CA in 2003 several mudslides caused untold damage, including the deaths of 16 people on Christmas day when a mudslide in the San Bernardino NF tore through a church camp where several families had gathered to celebrate. This photo is of Cable Canyon in S. California.
6. To minimize the after effects of wildfires, the Forest Service calls in a Burned Area Emergency Response (or BAER) team. The stated objective of the team is (read statement).
The team is composed of many different specialists (hydrologists, soil scientists, geologists, wildlife biologists, archeologists, etc) from, often, many different agencies. Because of their diverse backgrounds and employers, they often use data from a number of sources. They are required to perform field assessments as well as provide written reports, each with specific requirements (including erosion hazard) for the fire affected area.To minimize the after effects of wildfires, the Forest Service calls in a Burned Area Emergency Response (or BAER) team. The stated objective of the team is (read statement).
The team is composed of many different specialists (hydrologists, soil scientists, geologists, wildlife biologists, archeologists, etc) from, often, many different agencies. Because of their diverse backgrounds and employers, they often use data from a number of sources. They are required to perform field assessments as well as provide written reports, each with specific requirements (including erosion hazard) for the fire affected area.
7. Post-fire Assessments Need to begin immediately and completed within one week of containment
Recommend and implement treatments to minimize damage
Erosion, landslide prevention is a key element
Time is limited BAER assessments must be done within 7 days of fire containment and include recommendations for treatments. Because of their potential for damage to other resources, erosion and landslide prevention is often a key focus of the team�s recommendations.
This year many of our fires started in June but it�s not unusual to get fires in September while the vegetation is still dry. If mudslide and debris flow prevention measures are to be taken before winter rains hit (sometimes in October), assessment, recommendation, and implementation must take place on a very tight timeframe.BAER assessments must be done within 7 days of fire containment and include recommendations for treatments. Because of their potential for damage to other resources, erosion and landslide prevention is often a key focus of the team�s recommendations.
This year many of our fires started in June but it�s not unusual to get fires in September while the vegetation is still dry. If mudslide and debris flow prevention measures are to be taken before winter rains hit (sometimes in October), assessment, recommendation, and implementation must take place on a very tight timeframe.
8. Assessing the Potential for Erosion In California � Erosion Hazard Rating (EHR)
Developed jointly by the U.S. Forest Service and the California Soil Survey Committee (1989)
Used by many soil scientists, but not all
Some factors are subjective and require soils expertise, familiarity with local geography
Usually computed in a spreadsheet
There are a number of ways to quickly assess erosion potential but in California, the USFS has adopted a standard Erosion Hazard Rating system.
(Read 1st bullet)
Many, but not all soil scientists use this method because it generally uses readily available information and can be computed in a spreadsheet.
9. Computing EHR Erodibility Factors: Texture, aggregate stability
Climate Factor: 2 yr, 6 hr precipitation
Water Movement: Infiltration, depth to restrictive layer
Slope and slope length
Vegetative cover & distribution EHR calculations use a variety of factors and here is a general idea of the kinds of information required. EHR calculations use a variety of factors and here is a general idea of the kinds of information required.
10. Current Process � Part I Pre-Planning
Soil Scientists download soil surveys from Natural Resource Conservation Service website (http://soildatmart.nrcs.usda.gov)
Sometimes have hardcopy reports
Acquire burn severity maps
Go to the field
Now, I�d like to address the process that is currently used by many BAER soils specialists. Though there is some variation, it generally looks something like:
Soil scientists download the necessary survey from the internet. If possible, they acquire hardcopy reports But if hardcopy reports are not available, they can also download the tabular data from the internet.
Next, they must determine the severity of the fire. Because wildfires burn with varying intensity across the landscape, some areas within the fire perimeter may be totally devastated while others remain untouched.
Armed with as much information they are able to get, they head to the field.
In the next couple of slides, I�d like to look a little more closely at these steps and explain them in further detail.Now, I�d like to address the process that is currently used by many BAER soils specialists. Though there is some variation, it generally looks something like:
Soil scientists download the necessary survey from the internet. If possible, they acquire hardcopy reports But if hardcopy reports are not available, they can also download the tabular data from the internet.
Next, they must determine the severity of the fire. Because wildfires burn with varying intensity across the landscape, some areas within the fire perimeter may be totally devastated while others remain untouched.
Armed with as much information they are able to get, they head to the field.
In the next couple of slides, I�d like to look a little more closely at these steps and explain them in further detail.
11. Electronic soil surveys from NRCS
Spatial data in coverage or shapefile format with primary key field
Available Datasets Electronic soil surveys are available for almost all of California. Every Forest has a 3rd order soil survey available and most counties that surround the Forest have 3rd or 2nd order surveys at the soildatamart.
These downloads provide spatial data in shapefile or ArcInfo coverage format.
Looks like this:
An ordinary polygon layer with the slimmest of attributes � Soil Survey Area and Mapunit symbol and the mapunit key.Electronic soil surveys are available for almost all of California. Every Forest has a 3rd order soil survey available and most counties that surround the Forest have 3rd or 2nd order surveys at the soildatamart.
These downloads provide spatial data in shapefile or ArcInfo coverage format.
Looks like this:
An ordinary polygon layer with the slimmest of attributes � Soil Survey Area and Mapunit symbol and the mapunit key.
12. Electronic soil surveys from NRCS
Tabular data in Access database
Available Datasets The NRCS also includes an Access database with many, many tables and predefined reports. For instance, the one I have highlighted (RUSLE2 � which stands for Revised Universal Soil Loss Equation) can be used to obtain a report (click) with one of the attributes (Hydrologic Group) necessary to calculate erosion hazard.
The NRCS also includes an Access database with many, many tables and predefined reports. For instance, the one I have highlighted (RUSLE2 � which stands for Revised Universal Soil Loss Equation) can be used to obtain a report (click) with one of the attributes (Hydrologic Group) necessary to calculate erosion hazard.
13. Available Datasets � with one of the attributes (Hydrologic Group) necessary to calculate erosion hazard.
While all the information is here, it �s not a smooth and easy process to bring it all together for the area contained by the fire. This is especially true if the fire is not confined to a single soil survey area.� with one of the attributes (Hydrologic Group) necessary to calculate erosion hazard.
While all the information is here, it �s not a smooth and easy process to bring it all together for the area contained by the fire. This is especially true if the fire is not confined to a single soil survey area.
14. Available Datasets BARC � Burned Area Reflectance Classification
Produced for significant fires by USDA Forest Service Remote Sensing Applications Center
Satellite derived burn severity data (raster format)
Generally 4 classes: UNBURNED, LOW, MODERATE, HIGH
Often used as a proxy for vegetative cover Another piece of information that is often available for significant fires is known as a BARC dataset. BARC stands for Burned Area Reflectance Classification and is derived from satellite data. It has standard values from 0 to 255 but comes preclassified into four classes (Unburned, Low, Moderate, and High). The RSAC which provides the data, is now delivering it with its original 256 values so minor adjustments to the class ranges can be performed.
(click)Another piece of information that is often available for significant fires is known as a BARC dataset. BARC stands for Burned Area Reflectance Classification and is derived from satellite data. It has standard values from 0 to 255 but comes preclassified into four classes (Unburned, Low, Moderate, and High). The RSAC which provides the data, is now delivering it with its original 256 values so minor adjustments to the class ranges can be performed.
(click)
15. Available Datasets It looks like this, where the dark green is unburned and the red areas are where the soil burn severity is deemed to be high. And though it is suppose to reflect soil burn severity, it is often used as a proxy for vegetation cover (or lack thereof).It looks like this, where the dark green is unburned and the red areas are where the soil burn severity is deemed to be high. And though it is suppose to reflect soil burn severity, it is often used as a proxy for vegetation cover (or lack thereof).
16. Both datasets are validated in the field After gathering as much data and as many maps as possible, BAER team members validate them in the field.
As you can see from this photo, fire intensity can vary significantly but specialists try to compare the BARC classes to what appears on the ground.
After gathering as much data and as many maps as possible, BAER team members validate them in the field.
As you can see from this photo, fire intensity can vary significantly but specialists try to compare the BARC classes to what appears on the ground.
17. Both datasets are validated in the field Verifying the soil type as well as things like water infiltration rates are assessed, especially in areas where the fire effects were more severe.Verifying the soil type as well as things like water infiltration rates are assessed, especially in areas where the fire effects were more severe.
18. Current Process � Part II Post Assessment
Datasets are modified if needed
Elements for EHR are entered into spreadsheet
Spreadsheet is handed off to BAER Team GIS specialist
merges the datasets
calculates the EHR for each soil/burn severity type
creates map of priority treatment areas
Following the field assessment, the second phase begins. The data are modified if needed and the elements necessary to determine erosion hazard are entered into a spreadsheet. The pertinent attributes: soil map unit by burn severity and associated EHR, are then handed off to a GIS specialist who performs a number of tasks to provide the soil scientist with areas of high priority for treatment.
(click) It is these areas where having a toolset in the hands of the soil scientist may be useful. While some specialists have the necessary GIS skills to accomplish this on their own, many do not or do not use them often enough to be efficient under the pressure of a rapid assessment.Following the field assessment, the second phase begins. The data are modified if needed and the elements necessary to determine erosion hazard are entered into a spreadsheet. The pertinent attributes: soil map unit by burn severity and associated EHR, are then handed off to a GIS specialist who performs a number of tasks to provide the soil scientist with areas of high priority for treatment.
(click) It is these areas where having a toolset in the hands of the soil scientist may be useful. While some specialists have the necessary GIS skills to accomplish this on their own, many do not or do not use them often enough to be efficient under the pressure of a rapid assessment.
19. Data This sample spreadsheet that is used on a BAER assignment shows what needs to be addressed.. As you can see here in the white (hard to read) is the soil map unit and underneath is a list of the burn severity ratings � Unburned to Severe (or high). The other columns depict the factors used to assess EHR. As you can see many of them do not change regardless of fire severity � Texture, climate remain the same before and after but (click) water movement or infiltration may change. That�s one of the factors that is assessed during field work. Similarly, slope factors are not affected by the fire, but vegetation cover is. The cover percent ranges may vary under different forest conditions but they are figured into the (click) soil cover rating which also includes a uniformity factor. The overall rating value (in the yellow) is converted to an adjective rating. As you can see EHRs can be affected by fire severity.
These changes are the ones that need to be reflected in the new EHR layer.
This sample spreadsheet that is used on a BAER assignment shows what needs to be addressed.. As you can see here in the white (hard to read) is the soil map unit and underneath is a list of the burn severity ratings � Unburned to Severe (or high). The other columns depict the factors used to assess EHR. As you can see many of them do not change regardless of fire severity � Texture, climate remain the same before and after but (click) water movement or infiltration may change. That�s one of the factors that is assessed during field work. Similarly, slope factors are not affected by the fire, but vegetation cover is. The cover percent ranges may vary under different forest conditions but they are figured into the (click) soil cover rating which also includes a uniformity factor. The overall rating value (in the yellow) is converted to an adjective rating. As you can see EHRs can be affected by fire severity.
These changes are the ones that need to be reflected in the new EHR layer.
20. Looking now at the soil spatial data, here is a typical soil survey in a fire area. The numbers represent the soil map units.
(click)
Here are the soil map units overlaid with the burn severity layer. Some polygons were fairly uniformly burned but some vary from areas that were barely touched by the fire to areas that were cooked. Those polygons must be subdivided by burn severity to get an accurate Erosion Hazard layer.
Looking now at the soil spatial data, here is a typical soil survey in a fire area. The numbers represent the soil map units.
(click)
Here are the soil map units overlaid with the burn severity layer. Some polygons were fairly uniformly burned but some vary from areas that were barely touched by the fire to areas that were cooked. Those polygons must be subdivided by burn severity to get an accurate Erosion Hazard layer.
21. Here is the map that resulted from the previous combination. This one of the essential the products that is used to target treatment areas.Here is the map that resulted from the previous combination. This one of the essential the products that is used to target treatment areas.
22. As I mentioned, I haven�t developed anything yet but I�d like to give you an idea of how my toolset should work. Essentially, it will be a toolbar with 3 or 4 buttons.
(click) The first will take the pertinent soil data from the soil survey & export it so the soil scientist can use in a spreadsheet without having to type or copy & paste. The process of attaching the soil attributes to the soil layer is a little cumbersome and I don�t think I can automate it but I intend provide instructions on how to bring the attribute and spatial data together. As it turns out, this may actually be better accomplished in the Access database but we�ll see how things progress as I get more into the coding.As I mentioned, I haven�t developed anything yet but I�d like to give you an idea of how my toolset should work. Essentially, it will be a toolbar with 3 or 4 buttons.
(click) The first will take the pertinent soil data from the soil survey & export it so the soil scientist can use in a spreadsheet without having to type or copy & paste. The process of attaching the soil attributes to the soil layer is a little cumbersome and I don�t think I can automate it but I intend provide instructions on how to bring the attribute and spatial data together. As it turns out, this may actually be better accomplished in the Access database but we�ll see how things progress as I get more into the coding.
23. The next function I�d like to incorporate is simply importing the finished spreadsheet data with the soil map unit, burn severity, and EHR values. This will probably just be a duplicate more or less of the �Add Data� button that appears on the main ArcMap toolbar but it completes the complement of EHR tools so that everything is in one place.
The next function I�d like to incorporate is simply importing the finished spreadsheet data with the soil map unit, burn severity, and EHR values. This will probably just be a duplicate more or less of the �Add Data� button that appears on the main ArcMap toolbar but it completes the complement of EHR tools so that everything is in one place.
24. The next button will take the two edited datasets and combine them. My experience is that most people feel more comfortable with vector data than raster so I will probably convert the BARC data to vector (this is actually what the BARC providers in SLC recommend as well) and then combine it with the polygon soils data. It makes an ugly mess if you zoom in but simplifies acre calculations and the like. The next button will take the two edited datasets and combine them. My experience is that most people feel more comfortable with vector data than raster so I will probably convert the BARC data to vector (this is actually what the BARC providers in SLC recommend as well) and then combine it with the polygon soils data. It makes an ugly mess if you zoom in but simplifies acre calculations and the like.
25. And finally, a button to give the combined dataset EHR values from the imported table and display the result using the standard color scheme. At this point, the EHR dataset can be used for a variety of uses including locating treatment areas and perhaps targeting areas for more intense field evaluation.And finally, a button to give the combined dataset EHR values from the imported table and display the result using the standard color scheme. At this point, the EHR dataset can be used for a variety of uses including locating treatment areas and perhaps targeting areas for more intense field evaluation.
26. Anticipated Results A toolbar that can be added to ArcGIS Desktop software
Documentation for standardizing data to be exported and imported
Create interim merged dataset
Create new EHR layer and post it to Table of Contents with standard color coding So to recap:
My anticipated results will be to create a toolbar that can be added to ArcGIS Desktop software and to provide documentation for creating the tabular data to be imported and exported.
The tools will create a merged soil and burn severity dataset and, finally, an updated Erosion Hazard potential layer.
So to recap:
My anticipated results will be to create a toolbar that can be added to ArcGIS Desktop software and to provide documentation for creating the tabular data to be imported and exported.
The tools will create a merged soil and burn severity dataset and, finally, an updated Erosion Hazard potential layer.
27. Challenges Making SSURGO certified soil data usable
Extracting the necessary soil attributes and interpretations
Integrating the BARC (raster) and the soil data (vector) : simplicity vs. speed
Working with external tabular data (spreadsheet) There are some challenges:
Anyone who has worked with SSURGO soils data knows the challenge of making it easily accessible in GIS. In the case where more than one survey is involved, there is the additional issue of creating really large datasets so I�d like to be able to extract just the attributes for the soil map units within the fire area.
Also, I wrestle with the integration of BARC and Soil data. I personally like to work with raster data but I know most casual users of GIS prefer vector data. If datasets become large either by area or intricacy, working with vector can increase the processing time quite a bit. It may boil down to a choice between simplicity and speed.
Also, I am not very familiar with spreadsheets so I know there will be some issues for me in importing and exporting usable tabular data.There are some challenges:
Anyone who has worked with SSURGO soils data knows the challenge of making it easily accessible in GIS. In the case where more than one survey is involved, there is the additional issue of creating really large datasets so I�d like to be able to extract just the attributes for the soil map units within the fire area.
Also, I wrestle with the integration of BARC and Soil data. I personally like to work with raster data but I know most casual users of GIS prefer vector data. If datasets become large either by area or intricacy, working with vector can increase the processing time quite a bit. It may boil down to a choice between simplicity and speed.
Also, I am not very familiar with spreadsheets so I know there will be some issues for me in importing and exporting usable tabular data.
28. Opportunities Develop Web Application
Adequate internet not always available
Datasets require manipulation - ??
Create interactive form in the tool itself
Browsing
Attribute choices
Some thoughts that have been offered for the future are:
Developing a web application. When I first started thinking about this project, many BAER team sites did not have consistent or adequate internet access so a Web application would not always be available. Things are improving in that arena but still many sites are remote enough to not offer sufficient access. Satellite technology exists but resources are often scarce during widespread wildfire events and BAER teams are last on the list for supplies. Also, since the data often need manipulation after field assessment, it might require several iterations of uploading & downloading before the user is ready to perform the EHR tasks.
And, I�ve thought about how (or even if) to create a more interactive form in the tool. Perhaps allowing the user to choose which soil attributes to export or a browse function so users don�t have to conform to a specific naming convention or directory structure. This will depend in large part on the sophistication of my programming skills and ever looming time constraints.
29. Opportunities Incorporate Slope Class
No treatment on >60%
Between 30% and 60% - aerial only
And, finally, as I said, the next step after creating the EHR layer is identifying potential treatments. These are often limited by slope. Areas on steep slopes receive no treatment because it is too expensive. Mid-range slopes (30 to 60 %) can be treated aerially, and less than 30% slopes can be treated in a variety of often less expensive ways. It would be nice to add a tool that would identify treatment areas by their slope limitations.
And, finally, as I said, the next step after creating the EHR layer is identifying potential treatments. These are often limited by slope. Areas on steep slopes receive no treatment because it is too expensive. Mid-range slopes (30 to 60 %) can be treated aerially, and less than 30% slopes can be treated in a variety of often less expensive ways. It would be nice to add a tool that would identify treatment areas by their slope limitations.
30. Acknowledgements Dr. Patrick Drohan, Penn State University, advisor
Dave Young, Brad Rust, and Peter VanSusteren, USFS Soil Scientists
Employees of the Shasta-Trinity National Forest
Sue Cannon, USGS publication, http://pubs.usgs.gov/fs/2005/3106/pdf/FS-3106.pdf
That wraps up my presentation for my Capstone project. I�d like to take a few minutes to acknowledge my advisor Dr. Patrick Drohan. His patience with me through this rather stressful summer has been greatly appreciated.
I�d also like to thank my fellow soil scientists Dave Young, Brad Rust and Peter VanSusteren for their assistance in getting me moving in the right direction and support through my own BAER experiences this year.
All of the photos in my presentation were from my coworkers here on the Shasta-Trinity except for the mudslide photo which was courtesy of Sue Cannon at the US Geological Survey.
31. Thank you Jonna Cooper
jec336@psu.edu