Continuous Time Signals
Continuous Time Signals. Basic Signals – Singularity Functions Transformations of Continuous Time Signals Signal Characteristics Common Signals. Continuous-Time Signals. Assumptions: Functions , x(t), are of the one independent variable that typically represents time , t .

Continuous Time Signals
E N D
Presentation Transcript
Continuous Time Signals Basic Signals – Singularity Functions Transformations of Continuous Time Signals Signal Characteristics Common Signals
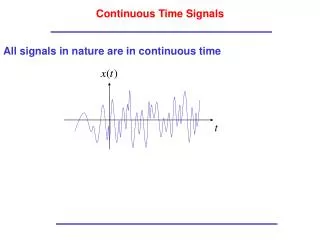
Continuous-Time Signals • Assumptions: • Functions,x(t), are of the one independent variable that typically represents time,t. • Time t can assume all real values: -∞ < t < ∞, • Function x(t) is typically a real function. Veton Këpuska
Singularity Functions Veton Këpuska
Unit Step Function • Unit step function definition: Veton Këpuska
Unit Step Function Properties • Scaling: • Unit step function can be scaled by a real constant K (positive or negative) • Multiplication: • Multiplication of any function, say x(t), by a unit step function u(t) is equivalent to defining the signal x(t) for t≥0. Veton Këpuska
Unit Ramp Function • Unit Ramp Function is defined as: Veton Këpuska
Unit Ramp Function Properties • Scaling: • Unit step function can be scaled by a real constant K (positive or negative) • Integral of the unit step function is equal to the ramp function: • Derivative of the unit ramp function is the unit step function. Slope of the straight line Veton Këpuska
Unit Impulse Function • Unit Impulse Function, also know as Dirac delta function, is defined as: Veton Këpuska
Unit Impulse Function Properties • Scaling: • Unit impulse function can be scaled by a real constant K (positive or negative) • Delta function can be approximated by a pulse centered at the origin Veton Këpuska
Unit Impulse Function Properties • Unit impulse function is related to unit step function: • Conversely: • Proof: • t<0 • t>0 Veton Këpuska
Time Transformation of Signals Veton Këpuska
Time Reversal: Veton Këpuska
Time Scaling |a| > 1 – Speed Up |a| < 1 – Slow Down Veton Këpuska
Time Shifting Veton Këpuska
Example 1 Veton Këpuska
Independent Variable Transformations Veton Këpuska
Example 2 Veton Këpuska
Example 3 Veton Këpuska
Independent Variable Transformations • Replace t with , on the original plot of the signal. • Given the time transformation: • Solve for • Draw the transformed t-axis directly below the -axis. • Plot y(t) on the t-axis. Veton Këpuska
Amplitude Transformations Veton Këpuska
Example 4 • Consider signal in the figure. Suppose the signal is applied to an amplifier with the gain of 3 and introduces a bias (a DC value) of -1. That is: Veton Këpuska
Example 5 Veton Këpuska
Transformations of Signals Veton Këpuska
Even and Odd Signals Veton Këpuska
Even and Odd Signals • Any signal can be expressed as the sum of even part and on odd part: Veton Këpuska
Average Value • Average Value of the signal x(t) over a period of time [-T, T] is defined as: • The average value of a signal is contained in its even function (why?). Veton Këpuska
Properties of even and odd functions • The sum of two even functions is even. • The sum of two odd functions is odd. • The sum of an even function and an odd function is neither even nor odd. • The product of two even functions is even. • The product of two odd functions is even. • The product of an even function and an odd function is odd. Veton Këpuska
Periodic Signals Veton Këpuska
Periodic Signals • Continuous-time signal x(t) is periodic if: • T is period of the signal. • A signal that is not periodic is said to be aperiodic. Veton Këpuska
Periodic Signals • If constant T is a period of of a function x(t) than nT is also its period, where T>0 and n is any positive integer. • The minimal value of the constant T >0 is a that satisfies the definition x(t)= x(t+ T) is called a fundamental period of a signal and it is denoted by T0. Veton Këpuska
Examples of Periodic Signals Veton Këpuska
Sinusoidal Signal Properties • A – Amplitude of the signal • - is the frequency in rad/sec • - is phase in radians Veton Këpuska
Sinusoidal Function Properties Note: Veton Këpuska
Periodicity of Sinusoidal Signal Veton Këpuska
Example: Sawtooth Periodic Waveform Veton Këpuska
Period and Frequency • Fundamental Period T0 – Measured in seconds. • Fundamental Frequency f0 – Measured in Hz – number of periods (cycles) per second or equivalently in radian frequency rad/s. Veton Këpuska
Testing for Periodicity Veton Këpuska
Testing for Periodicity Veton Këpuska
Composite Signals • Each signal can be decomposed into a sum of series of pure periodic signals (Taylor Series Expansion/Fourier Series Expansion) • The sum of continuous-time periodic signals is periodic if and only if the ratios of the periods of the individual signals are ratios of integers. Veton Këpuska
Composite Signals • If a sum of N periodic signals is periodic, the fundamental period can be found as follows: • Convert each period ratio, To1/Toi≤ i ≤ N , to a ratio of integers, where To1 is the period of the first signal considered and Toi is the period of one of the other N-1 signals. If one or more of these ratios is not rational, the sum of signals is not periodic. • Eliminate common factors from the numerator and denominator of each ratio of integers. • The fundamental period of the sum of signals is To=koTo1 ; kois the least common multiple of the denominators of the individual ratios of integers. Veton Këpuska
Composite Signals • If • x1(t) is periodic with period T1, and • x2(t) is periodic with period T2, • Then • x1(t)+x2(t) is periodic with period equal to the least common multiple (T1, T2) if the ratio of the two periods is a rational number, where k1 and k2 are integers: Veton Këpuska
Composite Signals • Let • T’= k1T1 = k2T2 • y(t) = x1(t)+x2(t) • Then • y(t+T’) = x1(t+T’)+x2(t+T’)= x1(t+ k1T1)+x2(t+ k2T2)= x1(t)+x2(t) = y(t) Veton Këpuska
Example 2.7 a) • Assume that v(t) is a sum of periodic signals given below. Determine if the signal is periodic and what its periodicity? Veton Këpuska
Solution • Determine whether v(t) constituent signals have periods with ratios that are integers (rational numbers): Veton Këpuska
Solution • Ratios of periods are rational numbers thus the composite signal v(t) is periodic. • Elimination of common factors: • T01/T02 = 4/7 • T01/T03 = 7/21=1/3 • Least common multiple of the denominator ratios: • n1= 3*7=21 • Fundamental period of v(t) is: • T0= n1 T01 = 21*2/3.5=12 Veton Këpuska
Example 2.7 b) • Assume that to v(t) is added a periodic signal x4(t) given below. Determine if the signal is periodic and what its periodicity? Veton Këpuska
Solution • Since ratio of the x1(t) and x4(t) periods is not a rational number the v(t) is not periodic. Veton Këpuska
Homework #1: • Forx(t)=Acos(t+) find • What are its maximum and minimum values? What are corresponding times when they occur? • What is the value of the function when it crosses vertical y- axis (ordinate) and horizontal x-axis (abscissa)? • At what time instances the function becomes zero? • Indicate all the above point values in a plot. Veton Këpuska
Homework #1 • Use the following MATLAB script to test your calculations and plot the function: function pfunc(A, f, th1, th2) % % Periodic Sine Function % A - gain (1) % f - frequency (1) % th1 - phase of the first signal (0) % th2 - phase of the second signal (pi/6) % w = 2.*pi.*f; % radial frequency fs = 0.0001*f; mint = -pi*f/2; maxt = pi*f/2; miny = -1.2*A; maxy = 1.2*A; t = mint:fs:maxt; % time axis y = A*cos(w*t+th1); plot(t, y, 'b', 'LineWidth',2); title('Periodic Signal'); grid on; hold; axis([mint maxt miny maxy]); y = A*cos(w*t+th2); plot(t, y, 'r', 'LineWidth',2); ylabel('cos(\omegat+\theta)'); xlabel('Angle x\pi [rad]'); grid on; hold; axis([mint maxt miny maxy]); x=-0.8; text(x,A*cos(w*x+th1),sprintf('%s+%3.2f)','\leftarrow cos(-\pit',th1),... 'HorizontalAlignment','left',... 'BackgroundColor','b'); x=-0.6; text(x,A*cos(w*x+th2),sprintf('%s+%3.2f)','\leftarrow cos(-\pit',th2),... 'HorizontalAlignment','left',... 'BackgroundColor','r'); Veton Këpuska