Download
1 / 4
0 likes | 13 Views
ExcelR Solutions offers a comprehensive Data Analyst Course designed to equip students with essential skills in data analysis. <br>The program covers various tools and techniques, including Excel, SQL, and Tableau, focusing on real-world applications. Students will gain hands-on experience through various live projects and case studies, ensuring they are well-prepared for a prospecting career in data analysis.<br>

E N D
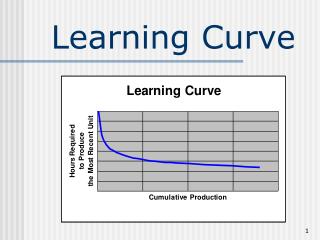
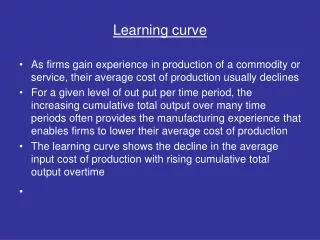
Role of Data Visualization in Identifying the Learning Curve to Get into a Prospective Data Analytics Career Data analytics is an ever-growing field with immense career prospects, attracting both beginners and mid-career professionals looking to upskill. As organizations increasingly rely on data-driven decision-making, there is a high demand for skilled data analysts. However, the path to mastering data analytics requires a clear understanding of complex concepts, including data manipulation, statistical analysis, and programming. One crucial tool that helps in mastering these skills is data visualization, which plays a significant role in identifying your learning curve and improving your ability to get into a prospective data analytics career. 1. Tracking Your Learning Curve with Data Visualization A learning curve represents how quickly a person can acquire new skills or knowledge in a given domain. For data analysts, the learning curve often involves mastering programming languages (like Python and R), statistical methods, data cleaning techniques, and data visualization tools. By using data visualization to track your learning progress, you can assess your strengths and weaknesses. You can create personal dashboards to monitor metrics like the time you spend on learning different skills, your performance in quizzes and projects, or your improvement in solving data problems. How Data Visualization Helps: ● Identifying Learning Patterns: Data visualization enables you to visualize your performance over time, helping you identify patterns and trends in your learning process. For example, if your performance in Python projects improves over time, a line chart showing your progress can serve as motivation to keep learning. ● Pinpointing Knowledge Gaps: By comparing your performance across different topics, you can quickly identify areas that need improvement. For instance, if you
struggle with statistical analysis but excel in data cleaning, a bar chart comparing your scores in these areas will highlight where to focus your efforts. ● Measuring Skill Proficiency: Visualization tools like heatmaps can help you assess your proficiency in various data analytics skills, such as data visualization, statistical analysis, or machine learning. This way, you can track how well you're progressing and adjust your study plan accordingly. 2. Using Data Visualization to Analyze Real-World Problems Mastering data visualization is not only crucial for understanding your learning curve but also for solving real-world business problems. In a data analytics career, your ability to present data in a visually appealing and meaningful way will set you apart from the Competition. Benefits of Data Visualization for Problem-Solving: ● Simplifying Complex Data: Data visualization helps in breaking down large, complex datasets into understandable visuals. For example, visualizations can be used to present customer behavior trends, sales performance, or market segmentation analysis in a way that stakeholders can easily grasp. ● Driving Data-Driven Decisions: Data visualizations are vital for decision-makers to interpret data and drive business strategies. As a data analyst, creating visualizations that clearly communicate insights will be a crucial part of your job. ● Fostering Collaboration: In many organizations, data visualizations are used in collaborative settings such as meetings and presentations. By displaying data through charts and graphs, you can foster more productive discussions and generate actionable insights. 3. Leveraging Visualization Tools to Enhance Learning and Career Prospects The ability to use advanced data visualization tools is a key requirement for data analytics professionals. Tools like Tableau, Power BI, and Excel allow you to create compelling visual narratives that drive decision-making in organizations. By mastering these tools during your data analyst course learning journey, you significantly enhance
your employability. How to Leverage Visualization Tools: ● Tableau: Known for its ability to handle large datasets and create interactive dashboards, Tableau is widely used by companies for data analysis and reporting. Learning Tableau can give you a competitive edge in the job market. ● Power BI: Power BI is a powerful business intelligence tool that integrates with Microsoft products, making it a valuable skill for professionals in data analytics. By mastering Power BI, you can create detailed reports and share insights across teams. ● Excel: While often considered a basic tool, Excel remains a vital part of data analysis. Understanding how to use Excel for data visualization, especially through advanced charting techniques and pivot tables, can add significant value to your skill set. 4. Creating a Data-Driven Portfolio Using Visualization Projects When applying for data analytics jobs, having a portfolio that demonstrates your ability to solve real-world problems through data visualization is crucial. Employers look for candidates who can turn raw data into actionable insights. By showcasing your skills in a portfolio with projects centered around data visualization, increases your chances of landing a high-paying job. How to Build a Strong Portfolio: ● Include Real-World Case Studies: Work on projects that replicate real-world business problems and demonstrate how you’ve used data visualization to solve them. For instance, create a project on sales forecasting using historical sales data or customer segmentation using behavioral data. ● Present Clear Visuals: Ensure that your portfolio includes easy-to-understand visuals that showcase your data storytelling abilities. Whether it’s a line chart showing sales growth or a pie chart breaking down customer demographics, clarity is key.
● Highlight Tool Proficiency: Make sure to indicate which tools you’ve used for each project, whether it’s Tableau, Power BI, or Excel. This will demonstrate to employers that you have the technical expertise needed for the role. Conclusion Data visualization plays a crucial role in identifying and improving your learning curve in data analytics. By visualizing your learning progress, analyzing real-world problems, and mastering the necessary tools, you can stay ahead of the curve and significantly enhance your career prospects. Whether you're a beginner pursuing data analytics course or a mid-career professional, data visualization not only helps you solve real-world problems but also equips you with the skills needed to succeed in a highly competitive field. ExcelR — Data Science, Data Analyst Course in Vizag Address: iKushal, 4th floor, Ganta Arcade, 3rd Ln, Tpc Area Office, Opp. Gayatri Xerox, Lakshmi Srinivasam, Dwaraka Nagar, Visakhapatnam, Andhra Pradesh 530016 Mobile number: 7411954369