Download
1 / 13
130 likes | 147 Views
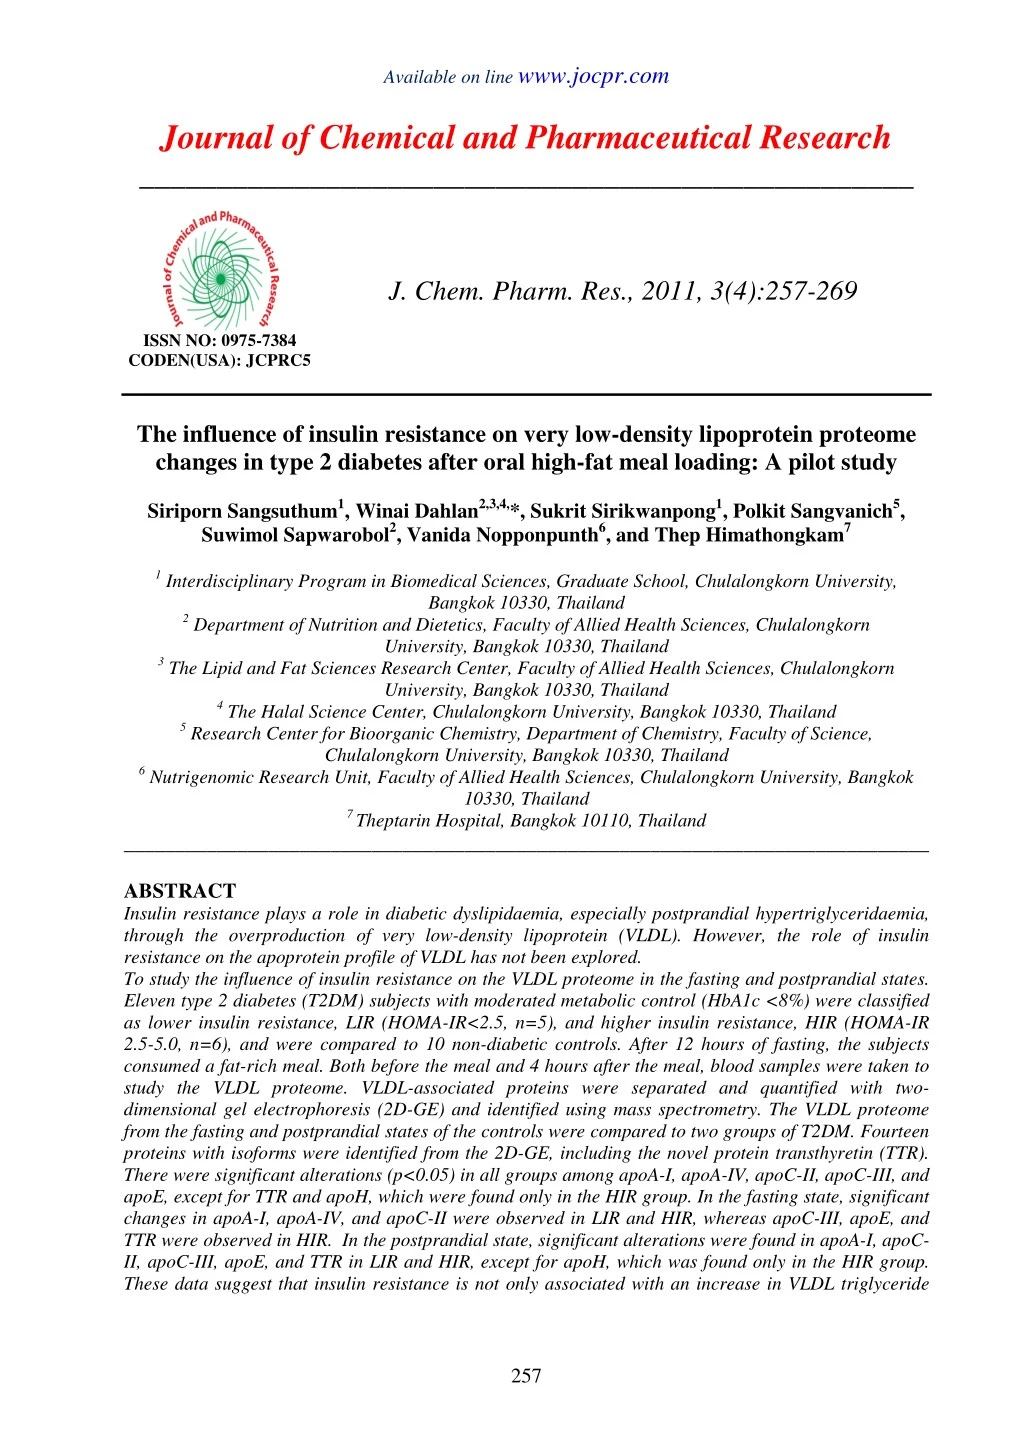
Insulin resistance plays a role in diabetic dyslipidaemia, especially postprandial hypertriglyceridaemia,<br>through the overproduction of very low-density lipoprotein (VLDL). However, the role of insulin<br>resistance on the apoprotein profile of VLDL has not been explored.<br>To study the influence of insulin resistance on the VLDL proteome in the fasting and postprandial states.<br>Eleven type 2 diabetes (T2DM) subjects with moderated metabolic control (HbA1c <8%) were classified<br>as lower insulin resistance, LIR (HOMA-IR<2.5, n=5), and higher insulin resistance, HIR (HOMA-IR<br>2.5-5.0, n=6), and were compared to 10 non-diabetic controls. After 12 hours of fasting, the subjects<br>consumed a fat-rich meal. Both before the meal and 4 hours after the meal, blood samples were taken to<br>study the VLDL proteome. VLDL-associated proteins were separated and quantified with twodimensional<br>gel electrophoresis (2D-GE) and identified using mass spectrometry.

E N D
Available on line www.jocpr.com Journal of Chemical and Pharmaceutical Research __________________________________________________ J. Chem. Pharm. Res., 2011, 3(4):257-269 ISSN NO: 0975-7384 CODEN(USA): JCPRC5 The influence of insulin resistance on very low-density lipoprotein proteome changes in type 2 diabetes after oral high-fat meal loading: A pilot study Siriporn Sangsuthum1,Winai Dahlan2,3,4,*, Sukrit Sirikwanpong1, Polkit Sangvanich5, Suwimol Sapwarobol2, Vanida Nopponpunth6, and Thep Himathongkam7 1 Interdisciplinary Program in Biomedical Sciences, Graduate School, Chulalongkorn University, Bangkok 10330, Thailand 2 Department of Nutrition and Dietetics, Faculty of Allied Health Sciences, Chulalongkorn University, Bangkok 10330, Thailand 3 The Lipid and Fat Sciences Research Center, Faculty of Allied Health Sciences, Chulalongkorn University, Bangkok 10330, Thailand 4 The Halal Science Center, Chulalongkorn University, Bangkok 10330, Thailand 5 Research Center for Bioorganic Chemistry, Department of Chemistry, Faculty of Science, Chulalongkorn University, Bangkok 10330, Thailand 6 Nutrigenomic Research Unit, Faculty of Allied Health Sciences, Chulalongkorn University, Bangkok 10330, Thailand 7 Theptarin Hospital, Bangkok 10110, Thailand ______________________________________________________________________________ ABSTRACT Insulin resistance plays a role in diabetic dyslipidaemia, especially postprandial hypertriglyceridaemia, through the overproduction of very low-density lipoprotein (VLDL). However, the role of insulin resistance on the apoprotein profile of VLDL has not been explored. To study the influence of insulin resistance on the VLDL proteome in the fasting and postprandial states. Eleven type 2 diabetes (T2DM) subjects with moderated metabolic control (HbA1c <8%) were classified as lower insulin resistance, LIR (HOMA-IR<2.5, n=5), and higher insulin resistance, HIR (HOMA-IR 2.5-5.0, n=6), and were compared to 10 non-diabetic controls. After 12 hours of fasting, the subjects consumed a fat-rich meal. Both before the meal and 4 hours after the meal, blood samples were taken to study the VLDL proteome. VLDL-associated proteins were separated and quantified with two- dimensional gel electrophoresis (2D-GE) and identified using mass spectrometry. The VLDL proteome from the fasting and postprandial states of the controls were compared to two groups of T2DM. Fourteen proteins with isoforms were identified from the 2D-GE, including the novel protein transthyretin (TTR). There were significant alterations (p<0.05) in all groups among apoA-I, apoA-IV, apoC-II, apoC-III, and apoE, except for TTR and apoH, which were found only in the HIR group. In the fasting state, significant changes in apoA-I, apoA-IV, and apoC-II were observed in LIR and HIR, whereas apoC-III, apoE, and TTR were observed in HIR. In the postprandial state, significant alterations were found in apoA-I, apoC- II, apoC-III, apoE, and TTR in LIR and HIR, except for apoH, which was found only in the HIR group. These data suggest that insulin resistance is not only associated with an increase in VLDL triglyceride 257
Winai Dahlanet al ______________________________________________________________________________ levels but also with alterations in VLDL protein composition, which possibly affects lipoprotein metabolism in diabetic patients. Key words: diabetes, insulin resistance, mass spectrometry, proteomics, very-low density lipoprotein, VLDL. ______________________________________________________________________________ INTRODUCTION Type 2 diabetes mellitus (T2DM) has dramatically increased worldwide, including in Thailand. The prevalence of diabetes is estimated to double by the year 2030 from 171 million in the year 2000. Over time, uncontrolled diabetes can lead to serious damage to the various body systems [1]. Fifty percent of people with diabetes die of cardiovascular disease, primarily heart disease and stroke [2], which are highly correlated with dyslipidaemia. Diabetic dyslipidaemia is characterised by a high level of fasting plasma triglycerides (TG), or hypertriglyceridaemia (HTG), which leads to a decrease in the levels of high-density lipoproteins (HDL) and a predominance of small low-density lipoprotein (s-LDL) cholesterol [3, 4]. However, in T2DM with normal metabolic control and a normal fasting TG level, HTG was only observed in the postprandial state, and postprandial HTG showed a stronger relationship with cardiovascular disease than did the fasting TG level [5, 6]. The development of dyslipidaemia, especially high very-low density lipoprotein (VLDL) levels, during diabetes is believed to result from insulin resistance. Alterations in VLDL secretion or clearance have been proposed as the primary factors in the pathogenesis of atherogenic dyslipidaemia in T2DM [4]. VLDL binds with cholesterol, phospholipids, apoproteins (apo) and TG, which are the major lipids in VLDL. VLDL TG are hydrolysed by lipoprotein lipases (LPL) and then taken up by liver receptors or converted to LDL. Such VLDL metabolism is mediated by apoproteins on their surface. To understand VLDL metabolism in T2DM, many studies have focused on the abnormality levels of VLDL proteins. However, these studies have been limited to certain proteins (e.g., apoB, apoC-II, apoC-III, and apoE) [7-10] but not whole VLDL-associated proteins. However, knowledge of a few proteins is not sufficient to understand VLDL metabolism in T2DM; therefore, it is important to simultaneously study the expression of multiple proteins. The mass spectrometry (MS) techniques available today have opened possibilities for clinical research, e.g., the use of tandem MS for analysis of drug metabolites in human plasma [11-13]. Moreover, MS combined with two-dimensional gel electrophoresis (2D-GE) has been used for protein research and also lipoprotein research. The proteomic studies of whole proteins in lipoproteins, such as VLDL, LDL and HDL [14-17]. Novel proteins along with major apoproteins have been found and have led to a new area of lipoprotein research. Furthermore, proteomics has been applied in clinical research for the study of LDL protein profiling from obese subjects [18]. In this study, a proteomics tool was used to investigate the effect of insulin resistance on the VLDL proteome in T2DM with varied insulin resistance from both the fasting and 4-h postprandial states. The 4-h postprandial state wasselected because it is the time at which a maximum amount of lipids occurs after a lipid-enriched meal [19, 20]. J. Chem. Pharm. Res., 2011, 3(4):257-269 258
Winai Dahlanet al ______________________________________________________________________________ EXPERIMENTAL SECTION Subjects Twenty-one subjects, aged 35 to 60 years, composed of 11 type 2 diabetic patients (7 women and 4 men) and 10 non-diabetic subjects (6 women and 4 men), were investigated. Diabetic subjects had no history or symptoms of any known disease apart from diabetes, never used insulin or lipid lowering drugs and did not engage in other studies. These subjects were recruited from the Theptarin hospital in Bangkok, Thailand. The stages of insulin resistance were attributed as follows in the diabetic patients: higher insulin resistance with HOMA-IR 2.5-5.0, HIR (n=6), and lower insulin resistance with HOMA-IR <2.5, LIR (n=5). Non-diabetic control subjects had no history or symptoms of any known disease and were randomly selected from among the research laboratory staff. Informed consent forms and study protocols were in accordance with the Declaration of Helsinki and were reviewed and approved by the ethics committee of the Theptarin Hospital and the ethical review committee for research involving human subjects and/or the use of animals in the research health science group of faculties, colleges and institutes, Chulalongkorn University, Bangkok, Thailand. Informed consent of all participating subjects was obtained. Biochemical analysis All subjects fasted overnight for 12 h before being fed a high-fat meal in the form of a milkshake and buttered bread. The meal contained 40 g fat/m2 body surface area and had an energy distribution of 72% fat, 24% carbohydrate and 4% protein. Blood samples were collected into EDTA-containing tubes (1 mg/ml) before the meal and 4 h after the meal and were kept on ice before the plasma was separated. Total cholesterol, HDL-cholesterol, LDL-cholesterol, triglycerides and glucose concentrations were assayed in plasma by enzymatic colourimetric methods (Human, Germany). Glycated haemoglobin (HbA1c) was measured by an immunoturbidity assay. Plasma insulin was measured by an immunochemiluminometric (ICMA) assay. The insulin resistance was estimated from the HOMA-IR index derived from fasting plasma insulin and glucose concentrations (insulin (µU/ml) x glucose (mg/dl)/405) [21]. VLDL preparation VLDL was isolated from plasma samples by sequential ultracentrifugation, as previously described [22]. Each individual VLDL fraction was further prepared before analysis by two- dimensional electrophoresis. The VLDL fraction was overlaid with normal saline, re-centrifuged under the same conditions and delipidated [23]. The resulting apoproteins were resuspended in sample buffer before being processed by isoelectric focusing. Protein concentration in the VLDL was determined using Bradford’s assay [24]. To normalise the variations among subjects, equal amounts of VLDL protein from each sample within the same group were pooled. Six pools of each sample group (control, LIR, HIR), three pools from the fasting state and three pools from the postprandial state were used for proteomics analysis. 2D-GE The first dimension of electrophoresis was performed using IPGphorII (Amersham BioSciences, USA) in triplicate for each pool of VLDL samples. A total of 120 µg of protein was applied by in-gel rehydration for 12 h using low voltage (30 V) at 20°C with a pH 3-10 NL IPG strip and focused at 52,500 Vh at a maximum voltage of 7,500 V. The entire process was performed as previously described [11]. The second dimension was performed using a PROTEAN II xi cell (Bio-Rad, USA) on 13% T- 2.6% C, 1 cm x 16 cm x 16 cm homogenous SDS-PAGE and run at a constant current of 50 mA until the tracking dye reached 1 cm from the gel bottom. J. Chem. Pharm. Res., 2011, 3(4):257-269 259
Winai Dahlanet al ______________________________________________________________________________ Staining and image analysis Resolved proteins were detected by Colloidal Coomassie Brilliant Blue G250 and visualised using ImageScanner II in combination with ImageMaster 2D Platinum software (Amersham BioSciences). The percent intensity volume (%vol) of each individual spot (relative to the intensity volumes of all spots) was used for comparative analysis. Digestion of protein spots The protein spots were excised from the stained gel and placed into a 0.5-mL microcentrifuge tube. The gel plaques were then washed with 100 µl of 25 mM NH4HCO3/50% acetonitrile until the plaques were clear. Tryptic digestion was performed using 20 ng/µl of proteomics grade trypsin (Sigma) in 25 mM NH4HCO3 overnight at 37°C. The supernatant was transferred to a separate tube and dried until almost completely evaporated. Mass spectrometry The tryptic digested peptides were analysed in positive modes for all analysis. The peptide mass was determined by MALDI-TOF MS (MicroflexTM series, Bruker Daltonics GmbH, Germany) while LC-MS and LC-MS/MS used an ESI ion trap MS (ESI-IT MS) (Esquire HCT, Bruker Daltonics GmbH) directly connected with an HPLC (Agilent 1100 Series, Agilent Technologies, Palo Alto, CA, USA). For MALDI MS, tryptic peptides were mixed 1:1 with a CHCA matrix (10 mg/mL in 50% ACN, 0.1% TFA) and operated in reflector mode with delayed extraction in a 600 to 3,000 m/z range under the control of FlexAnalysis 3.0. ESI-IT MS samples were separated through a BioBasic C18 column, 1.0 mm x 150 mm (Thermo Finnigan, USA), with a gradient elution of solvent A (0.1% v/v FA in 98% H2O) and solvent B (95% ACN containing 0.1% v/v FA), starting from 5% B to 65% B over 65 min and then from 65% B to 80% B over 5 min, followed by a 25-min hold at 5% B. The column temperature was set at 35°C. ESI-IT MS was performed, and the electrospray capillary potential was 3,500 V relative to the end plate. The temperature of the drying gas was 300°C, and the dry and nebulising gases were set at 8 ml/min and 35 psi, respectively. The maximum accumulation time was 200 milliseconds. Tandem MS experiments were performed in product ion scanning mode, where the five best S/N recursor ion peaks were automatically selected in a 300 to 2,500 m/z mass range. Hystar and Esquire Control software (Bruker Daltonics GmbH) were used for instrument control. Database search The results from MALDI MS and LC-MS/MS were subjected to a database search using the Mascot search engines (www.matrixscience.com) and compared to the Swiss-Prot database. The restrictions were human species, a maximum of one missed cleavage by trypsin and cysteine modification by carbamidomethylation. All peptide mass values were considered monoisotopic. The results from MALDI were searched as peptide mass fingerprints (PMFs), whereas those from tandem MS analysis were searched as MS/MS ion searches against a database. A significant match (p<0.05) was considered from a MASCOT probability-based MOWSE score. Statistical analysis All variables were tested for normal distribution by the One Sample-Kolmogorov-Smirnov Test. The statistical analysis was performed with SPSS 17.0. Continuous data were expressed as the mean ± SEM. Differences among three groups were identified with analysis of variance (ANOVA). The student’s t test was used to analyse differences within a group. P< 0.05 was considered significant. J. Chem. Pharm. Res., 2011, 3(4):257-269 260
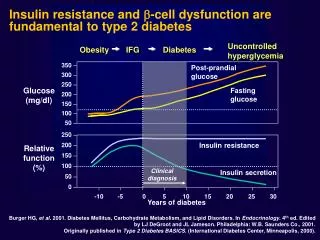
Winai Dahlanet al ______________________________________________________________________________ RESULTS AND DISCUSSION Clinical and biochemical characteristics of the subjects Insulin resistance is known to play a role in diabetic dyslipidaemia, or hypertriglyceridaemia, when there are low levels of HDL and a predominance of small LDL. In this study, we recruited diabetic patients who had different stages of insulin resistance, optimal fasting plasma triglycerides and total cholesterol. The subjects were classified into two groups: LIR (HOMA-IR < 2.5), and HIR (HOMA-IR 2.5-5.0). The characteristics of all subjects are shown in Table 1; the duration of diabetes between diabetic groups, age, blood pressure, waist-to-hip ratio and fasting TC were comparable and not considered significantly different (p < 0.05). The HIR group had a significantly (p < 0.05) higher body mass index (BMI), fasting TG level, insulin level and HOMA-IR compared to the LIR and control groups, although these significant differences were not observed between the LIR and control groups. HDL cholesterol was significantly lower in the HIR group compared to the groups. As expected, blood glucose and HbA1c were significantly higher (p < 0.05) in diabetic subjects than in the controls but not significantly different between diabetic groups. Table 1: Clinical and biochemical characteristics of type 2 diabetes and control groups in fasting and 4-h postprandial states Parameters Control (n=10) J. Chem. Pharm. Res., 2011, 3(4):257-269 Type 2 Diabetes LIR group (n=5) 47.2±1.9 7.4±2.1 22.6±1.9 124.6±12.9 79.4±7.4 0.84±0.04 192.2±14.3 66.0±8.2 51.2±3.8 134.3±19.8 134.4±16.6 π 2.8±0.4 1.0±0.2 7.4±0.8π 198.8±14.5 184.6±34.2 ƒ 51.2±3.3 131.2±16.2 135.8±16.6 π 8.2±1.0 ƒ HIR group (n=6) 49.3±3.9 5.7±1.0 28.6±1.8 π* 123.2±7.7 76.7±3.3 0.87±0.02 185.8±6.3 147.0±12.8 π* 41.7±3.1 π 115.9±8.1 126.5±10.7π 11.5±1.2 π* 3.6±0.4 π* 7.3±0.5 π 198.3±10.8 358.0±31.3 π*ƒ 41.3±2.3 π* 111.4±11.1 π* 129.8±10.7 π 27.0±3.8 π*ƒ 46.0±1.7 - 23.6±0.7 121.0±4.8 68.1±1.8 0.83±0.02 203.5±13.6 99.6±11.9 51.7±3.6 123.8±16.2 89.0±2.7 5.2±0.8 1.2±0.2 5.7±0.2 204.1±14.7 239.2±32.6 ƒ 51.7±3.5 123.2±14.7 99.5±2.7 9.4±1.8 ƒ Age, years Duration of diabetes, years BMI, kg/m2 Blood pressure, mmHg -Systolic -Diastolic Waist-to-hip ratio Fasting Total cholesterol, mg/dl Triglycerides, mg/dl HDL cholesterol, mg/dl LDL cholesterol, mg/dl Glucose, mg/dl Insulin, µU/ml HOMA-IR HbA1c (%) 4-h postprandial Total cholesterol, mg/dl Triglycerides, mg/dl HDL cholesterol, mg/dl LDL cholesterol, mg/dl Glucose, mg/dl Insulin, µU /ml The results are given as the means ± SEM. π P<0.05 compared with the control group, and * P<0.05 when the LIR group in the fasting or postprandial state were compared. ƒ P<0.05 when the fasting and postprandial states were compared within an individual group. LIR = lower insulin resistant type 2 diabetes with HOMA-IR < 2.5; HIR = higher insulin resistant type 2 diabetes with HOMA-IR 2.5-5.0 Postprandial changes of biochemical values in subjects Although the T2DM group had optimal blood glucose levels with normal fasting TG levels, a HTG dyslipidaemia response to a high fat meal was presented [25]. As shown in Table 1, plasma TG levels were higher than before the meal in all groups, with significant differences at p < 0.05. 261
Winai Dahlanet al ________________________________________ The changes of TG seemed studies [25, 26]. The highest level of postprandial plasma TG was observed in the HIR group, with a significant difference in the LIR and control groups, but it was not between the LIR group and controls levels and differed significantly ( higher postprandial insulin levels compared to the LIR and control groups, which were not significantly different when compared to themselves. Although the insulin response to the high fat meal was higher in diabetic subjects, the postprandial glucose levels were higher than the control. This increase is the result of insulin resistance or the failure of insulin to regul glucose level. The total cholesterol, LDL were about the same as in the fasting state J. Chem. Pharm. Res., 2 . Chem. Pharm. Res., 2011, 3(4):257-269 ______________________________________ ________________________________________ to correlate with insulin resistance, which agrees wit ]. The highest level of postprandial plasma TG was observed in the HIR group, with a significant difference in the LIR and control groups, but it was not and controls. All groups also had an increase in postprandial insulin levels and differed significantly (p<0.05) from the fasting state. The HIR group had significantly higher postprandial insulin levels compared to the LIR and control groups, which were not n compared to themselves. Although the insulin response to the high fat meal was higher in diabetic subjects, the postprandial glucose levels were higher than the control. This increase is the result of insulin resistance or the failure of insulin to regul glucose level. The total cholesterol, LDL cholesterol and HDL cholesterol levels in all groups were about the same as in the fasting state, which agrees with previous stud which agrees with previous ]. The highest level of postprandial plasma TG was observed in the HIR group, with a significant difference in the LIR and control groups, but it was not significantly different had an increase in postprandial insulin om the fasting state. The HIR group had significantly higher postprandial insulin levels compared to the LIR and control groups, which were not n compared to themselves. Although the insulin response to the high- fat meal was higher in diabetic subjects, the postprandial glucose levels were higher than the control. This increase is the result of insulin resistance or the failure of insulin to regulate the cholesterol levels in all groups with previous studies [25, 26]. Figure 1: Representative VLDL proteins from 2 strips, with 120 GE and detected by Colloidal Coomassie Blue staining. proteins: apoC-III(1a-c); apoC-II (2); apoA-I (6a-c); apoE (7a-f); apoA-IV (8); acid-glycoprotein 1, AAG1 (11); apoH (12a 2D-GE pattern of VLDL proteins between T2DM and controls Insulin has an inhibitory effect on VLDL secretion, but in T2DM patients who have an insulin resistant state, the inhibitory effect of insulin on VLDL secretion is reduced, leading to the overproduction of VLDL [27]. However, the role of insulin resistance on the protein profiles of VLDL in T2DM has not been elucidated. In this study, proteomic tools were used to investigate the influence of insulin resistance on VLDL the influence of insulin resistance on VLDL proteome changes in T2DM proteome changes in T2DM from the fasting and Representative VLDL proteins from 2 strips, with 120 µ µ µ µg of proteins each, were GE and detected by Colloidal Coomassie Blue staining. The numbers on the gel refer to the identified II (2); serum amyloid A-IV (3); apoC-IV (4); transthyretin, TTR (5a IV (8); α α α α-1-antitrypsin, A1AT (9); α α α α-2-HS-glycoprotein, AHSG (10); apoH (12a-c); albumin (13); and apoB-100 (14). g of proteins each, were separated with 2D- The numbers on the gel refer to the identified ; transthyretin, TTR (5a-b); glycoprotein, AHSG (10); α α α α-1- GE pattern of VLDL proteins between T2DM and controls Insulin has an inhibitory effect on VLDL secretion, but in T2DM patients who have an insulin resistant state, the inhibitory effect of insulin on VLDL secretion is reduced, leading to the tion of VLDL [27]. However, the role of insulin resistance on the protein profiles of VLDL in T2DM has not been elucidated. In this study, proteomic tools were used to investigate VLDL in T2DM has not been elucidated. In this study, proteomic tools were used to investigate Insulin has an inhibitory effect on VLDL secretion, but in T2DM patients who have an insulin resistant state, the inhibitory effect of insulin on VLDL secretion is reduced, leading to the tion of VLDL [27]. However, the role of insulin resistance on the protein profiles of 262
Winai Dahlanet al ________________________________________ postprandial states. Delipidated VLDL was analysed with 2D MS/MS ion searches against the Swiss spots represented 14 different proteins, and their isoforms wer spots represented 14 different proteins, and their isoforms were identified (Figure 1, Table 2). J. Chem. Pharm. Res., 2 . Chem. Pharm. Res., 2011, 3(4):257-269 ______________________________________ ________________________________________ Delipidated VLDL was analysed with 2D-GE and identified by PMF and MS/MS ion searches against the Swiss-Prot database via the Mascot tool. Twenty Prot database via the Mascot tool. Twenty-six protein GE and identified by PMF and e identified (Figure 1, Table 2). Table 2: Profiling of VLDL proteins and the corresponding isoforms identified by 2D Profiling of VLDL proteins and the corresponding isoforms identified by 2D searching the Swiss-Prot database Profiling of VLDL proteins and the corresponding isoforms identified by 2D-GE and MS/MS by Protein name Accession Accession no. P02656 P02655 P35542 P55056 P02766 P02647 P02649 P06727 Q86U18 P02765 P02763 P02749 Q9P157 Q13787 Isoform spots 1a-1c 2 3 4 5a-5b 6a-6c 7a-7f 8 9 10 11 12a-12c 13 14 Calculated pI value 5.23 4.72 9.27 9.19 5.52 5.56 5.65 5.28 5.37 5.43 4.93 8.34 5.92 6.61 Calculated protein mass 10 845 11 277 14 797 14 543 15 877 30 759 36 132 45 371 46 707 39 300 23 497 38 273 69 321 515 241 515 241 Calculated protein % (Da) Coverage 37 59 63 35 65 70 64 58 30 8 30 44 19 34 10 845 11 277 14 797 14 543 15 877 30 759 36 132 45 371 46 707 39 300 23 497 38 273 69 321 apoC-III apoC-II SAA4 apoC-IV TTR apoA-I apoE apoA-IV A1AT AHSG AAG1 apoH albumin apoB-100 Unknown proteins were detected at identified as apoH with 44% sequence coverage and TTR with 65% sequence coverage, respectively. The VLDL proteome from the fasting and 4 were compared with the LIR and HIR groups. Every gel had the same pattern of VLDL proteins; however, the relative amount of some proteins were different. Several VLDL proteins from diabetic groups were different compared with the non Unknown proteins were detected at pI/Mr 8.3/38 273 and 5.5/15 877 in the 2D gel, which were identified as apoH with 44% sequence coverage and TTR with 65% sequence coverage, respectively. The VLDL proteome from the fasting and 4-h postprandial states of th were compared with the LIR and HIR groups. Every gel had the same pattern of VLDL proteins; however, the relative amount of some proteins were different. Several VLDL proteins from diabetic groups were different compared with the non-diabetic group (Figure 2A 8.3/38 273 and 5.5/15 877 in the 2D gel, which were identified as apoH with 44% sequence coverage and TTR with 65% sequence coverage, h postprandial states of the controls were compared with the LIR and HIR groups. Every gel had the same pattern of VLDL proteins; however, the relative amount of some proteins were different. Several VLDL proteins from oup (Figure 2A-C). %Volume Figure 2A: Comparison of VLDL protein from the fasting state with significant changes in the LIR and HIR compared with the with thecontrols. P<0.05 compared with the controls : Comparison of VLDL protein from the fasting state with significant changes in the LIR and HIR : Comparison of VLDL protein from the fasting state with significant changes in the LIR and HIR the controls 263
Winai Dahlanet al ________________________________________ A contrasting alteration between isoform (spot 6a) was significantly lower in both diabetic groups than the fasting and postprandial states. decreased in both diabetic groups compared to the control in the fasting state and was increased compared to the control in the postprandial state. The increase postprandial state was significantly different th increase in the apoA-I acidic isoform in the postprandial state biosynthesis. The chylomicrons and VLDL are secreted into the lymph in the content of the apoA-I acidic isoform. Alternatively, the apoA high affinity for triglyceride- these lipoproteins during fat absorption could result in an increase in the ap [28]. J. Chem. Pharm. Res., 2 . Chem. Pharm. Res., 2011, 3(4):257-269 ______________________________________ ________________________________________ alteration between isoforms was found in apoA-I. The major isoform of apoA (spot 6a) was significantly lower in both diabetic groups than in the controls fasting and postprandial states. However, the acidic isoform (spot 6b) was si decreased in both diabetic groups compared to the control in the fasting state and was increased compared to the control in the postprandial state. The increase in the apoA postprandial state was significantly different than in the fasting state in all subject groups. I acidic isoform in the postprandial state represents a direct intestinal biosynthesis. The chylomicrons and VLDL are secreted into the lymph system I acidic isoform. Alternatively, the apoA-I acidic isoform may have a -rich lipoprotein particles, and an increase in the concentration of these lipoproteins during fat absorption could result in an increase in the ap these lipoproteins during fat absorption could result in an increase in the apoA-I acidic isoform I. The major isoform of apoA-I controls (p<0.05) for both , the acidic isoform (spot 6b) was significantly decreased in both diabetic groups compared to the control in the fasting state and was increased the apoA-I acid isoform in the fasting state in all subject groups. The represents a direct intestinal system with an increase I acidic isoform may have a and an increase in the concentration of Figure 2B: Comparison of VLDL protein from the fasting state with significant changes only in the HIR compared with the controls. compared with the controls. P<0.05 compared with the controls study using SELDI-TOF MS showed increased levels of apoC In our study, apoC-III was found to be significantly higher in the HIR control groups in the fasting state, and a significant increase in both diabetic gr compared to the control in the postprandial state. ApoC-III is downregulated by thyroid hormone, insulin and the cytokine interleukin-1. Thus, an increase in apoC might be the result of an insulin resistant state [30]. ApoC-III plays important roles in triglyceride metabolism by directly inhibiting lipoprotein lipase in vitro, ing clearance [31, 32]. ApoC-III of human lipoproteins has an increased binding affinity to vascular proteoglycans in vitro [33], and high amounts of apoC considered to be correlated with cardiovascular disease. TTR, which has not been identified in VLDL before, was significantly higher in the diabetic group compared to only significantly higher in the HIR from the fasting state The unique predominance of TTR in the insulin-resistant state was confirmed increase in both the fasting and postprandial states only found in the HIR diabetic group. transporter for thyroxin (T4) and retinol (vitamin A) in the blood has a direct effect on lipoprotein metabolism, especially on CETP activity TTR itself is believed to correlate with insulin resistance. An increase found in plasma from insulin-resistant obese mice [36 plasma TTR level was also found in insulin-resistant humans who had lipid profiles associated ] and was recently found in LDL, which was significantly more abundant in obese subjects than lean subjects [18]. Furthermore, TTR has been described as a biomarker for myocardial infarction and identified in human coronary atherosclerotic plaque transporter, TTR also acts as a protease that degrades apoA atherosclerosis by reducing the cholesterol efflux capacity of HDL I amyloid deposits, which are frequently found in the aortic intima are frequently found in the aortic intima [39]. The Comparison of VLDL protein from the fasting state with significant changes only in the HIR Comparison of VLDL protein from the fasting state with significant changes only in the HIR <0.05 compared with the controls A previous proteomics study using SELDI TTR in T2DM serum [29]. In than in the control groups in the fasting state was found compared to the control in the postprandial state thyroid hormone, insulin and the cytokine interleukin might be the result of an insulin resistant state [ triglyceride metabolism by directly inhibiting lipoprotein lipase transgenic mice and reducing increased binding affinity to vas are considered to be correlated with cardiovascular disease. TTR in VLDL before, was significantly higher in the diabetic group the postprandial state and only significantly higher in The unique predominance of TTR in the insulin increase in both the fasting and postprandial states only found i Transthyretin functions as a transporter for thyroxin (T4) and retinol (vitamin A) in the blood [34]. Thyroxine (T4) has a direct effect on lipoprotein metabolism, especially on CETP activity [35]. Furthermore, TTR itself levels has been found in plasma from insulin plasma TTR level was also found in insulin with cardiovascular risk [37] and w abundant in obese subjects than lean subjects [ biomarker for myocardial infarction and identified in human coronary [38]. Aside from being a transporter, TTR also acts as a protease be the cause of atherosclerosis by reducing also increase apoA-I amyloid deposits TOF MS showed increased levels of apoC-III and III was found to be significantly higher in the HIR significant increase in both diabetic groups III is downregulated by 1. Thus, an increase in apoC-III production III plays important roles in , retarding lipolysis in III of human lipoproteins has an and high amounts of apoC-III which has not been identified compared to the control group in HIR from the fasting state (p<0.05). resistant state was confirmed by a significant n the HIR diabetic group. transporter for thyroxin (T4) and retinol (vitamin A) in the blood has a direct effect on lipoprotein metabolism, especially on CETP activity ed to correlate with insulin resistance. An increase in TTR 6]. In addition, a high resistant humans who had lipid profiles associated recently found in LDL, which was significantly more ]. Furthermore, TTR has been described as a atherosclerotic plaques degrades apoA-I and may cholesterol efflux capacity of HDL. TTR may - 264 -
Winai Dahlanet al ________________________________________ effect of alterations in TTR in the VLDL protein profile from diabetic subjects is at present unknown, but the significance of increased amounts of TTR in the fasting and postprandial states of HIR diabetic subjects cannot be negl insulin resistant state. J. Chem. Pharm. Res., 2 . Chem. Pharm. Res., 2011, 3(4):257-269 ______________________________________ ________________________________________ effect of alterations in TTR in the VLDL protein profile from diabetic subjects is at present unknown, but the significance of increased amounts of TTR in the fasting and postprandial states diabetic subjects cannot be neglected. However, TTR might be considered a marker of effect of alterations in TTR in the VLDL protein profile from diabetic subjects is at present unknown, but the significance of increased amounts of TTR in the fasting and postprandial states , TTR might be considered a marker of an Figure 2C: Comparison of VLDL protein from 4 HIR compared with the controls. HIR compared with the controls. P<0.05 compared with the controls Comparison of VLDL protein from 4-h postprandial state with significant changes in the LIR and h postprandial state with significant changes in the LIR and <0.05 compared with the controls ApoE was found to be significantly higher in controls than postprandial state and only significantly lower in the HIR group in a fasting state is also considered to be important in the metabolism of triacylglycerol promoting the clearance of lipoproteins. A decrease patients with a metabolic syndrome and T2DM. lipoprotein metabolism, e.g., three isoforms that vary at two positions in contains cysteine residues at C arginine residue at R176, whereas apoE4 has two arginine residues at those positions. ESI-ion trap LC-MS/MS to clarify MS/MS to clarify the apoE isoforms in our subjects. MS/MS sequencing of apoE isoforms in our subjects. MS/MS sequencing of ApoE was found to be significantly higher in controls than in the LIR and HIR groups in th postprandial state and only significantly lower in the HIR group in a fasting state is also considered to be important in the metabolism of triacylglycerol the clearance of lipoproteins. A decrease in apoE has been demonstrated in LDL from patients with a metabolic syndrome and T2DM. Genetic polymorphisms of apoE affect a apoE4 isoform has been associated with CAD [ three isoforms that vary at two positions in the amino acid sequence, at contains cysteine residues at C130 and C176, and ApoE3 contains a cysteine residue at C , whereas apoE4 has two arginine residues at those positions. , whereas apoE4 has two arginine residues at those positions. We used the LIR and HIR groups in the postprandial state and only significantly lower in the HIR group in a fasting state (p<0.05). ApoE is also considered to be important in the metabolism of triacylglycerol-rich lipoproteins by apoE has been demonstrated in LDL from enetic polymorphisms of apoE affect apoE4 isoform has been associated with CAD [40]. ApoE has at 130 and 176. ApoE2 cysteine residue at C130 and an - 265 -
Winai Dahlanet al ________________________________________ apoE provided signals at 1,221.51 and 1,185.63 m/z, which corresponded to two peptides, LGADMEDVC130GR and LLRDADDLQK/R confirmed that our subjects we levels and lipid levels were not affected J. Chem. Pharm. Res., 2 . Chem. Pharm. Res., 2011, 3(4):257-269 ______________________________________ ________________________________________ 1,221.51 and 1,185.63 m/z, which corresponded to two peptides, GR and LLRDADDLQK/R176, respectively (Figure 3, Table 3). This r were apoE3 homozygous donors and that the alteration and lipid levels were not affected by apoE polymorphisms. 1,221.51 and 1,185.63 m/z, which corresponded to two peptides, , respectively (Figure 3, Table 3). This result the alteration in apoE Figure 3A: MS/MS spectra of m/z MS/MS spectra of m/z 612.2; [M+2H]2+ represents m/z of 1221.5 [M+H] represents m/z of 1221.5 [M+H]+ of apoE. Figure 3B: MS/MS spectra m/z MS/MS spectra m/z 594.2; [M+2H]2+ represents m/z of 1185.6 [M+H] represents m/z of 1185.6 [M+H]+ of apoE. - 266 -
Winai Dahlanet al ______________________________________________________________________________ Table 3: MS/MS analysis of apoE polymorphism Observed parent peak mass J. Chem. Pharm. Res., 2011, 3(4):257-269 Calculated parent peak mass Amino acid position Ion scores Sequence MS/MS ion peaks 231.9(y2); 357.1 (b4); 392.1(y3); 491.2(y4); 606.3(y5); 735.3(y6); 732.3(b7); 866.4(y7); 981.3(y8);1052.4(y9); 1109.5(y10) 275.2(y2); 388.2(y3); 498.3(b4); 503.3(y4); 684.3(b6); 799.4(b7); 912.4(b8);1040.6(b9); LGADMEDVC130GR 122-132 612.2 1221.5 81 LLRDADDLQK/R176 166-175 594.2 1185.6 40 With respect to the functional correlation between apoA-IV and apoC-II, ApoA-IV is required for efficient apoC-II-mediated activation of lipoprotein lipase and facilitated CETP activity and apoC-II function as the activator of lipoprotein lipase. ApoA-IV was found to be significantly decreased in diabetic groups compared to the controls, especially in the HIR diabetic groups in the fasting state (p<0.05). The decrease of apoA-IV levels in the diabetic groups was found to be associated with insulin resistance in T2DM because the apoA-IV level increased when T2DM was treated with insulin [41]. ApoC-II was found to be significantly lower in HIR than the controls in both the fasting and postprandial states (p<0.05). The largest decrease in apoC-II was found in HIR. ApoC-II was found to be significantly higher in LIR than in the controls in the fasting state. The abnormality of apoA-IV and apoC-II levels was clearly observed in the HIR group; however, in the LIR group, the decreasing level of apoA-IV seemed to be compensated by the apoC-II level. In addition to lipoprotein metabolism, apoA-IV is also associated with an increased prevalence of vascular disease. ApoH, also known as β2-glycoprotein I, is associated with lipoprotein metabolism. ApoH is present in plasma and binds to the twomajor lipoprotein fractions, VLDL and HDL [42]. ApoH levels are closely associated with TG levels and have been found to be higher in diabetic subjects [43]. In the present study, apoH was only found to be significantly higher in HIR than in the controls in the postprandial group. It could be speculated that this change of apoH level was temporarily reflected in the high level of TG, which is an influence of the insulin resistant state. CONCLUSION This study provides the first proteomics analysis of VLDL from T2DM that varied with insulin resistant states and demonstrates that insulin resistance not only plays important roles in postprandial dyslipidaemia but also affects the VLDL protein composition, as is clearly observed in the HIR diabetic group. This alteration of proteins could affect lipoprotein metabolism in diabetic patients and possibly lead to complications in diabetic patients, such as atherosclerosis. A decrease in apoA-IV is necessary for the efficient release of LPL and apoC-II to activate LPL activity. An increase in apoC-III inhibits LPL activity, together with a decrease in apoE, which is used to bind the hepatic VLDL receptor, particularly in the postprandial state. This leads to a decrease in VLDL catabolism and VLDL clearance, prolonging VLDL circulation in the blood and resulting in postprandial dyslipidaemia in diabetes. Moreover, an increase in TTR, a transport protein, has not been identified in VLDL before and remains to be further investigated. - 267 -
Winai Dahlanet al ______________________________________________________________________________ Acknowledgements This study was funded by the Commission of Higher Education, Ministry of Education. We thank all volunteers for their devoted participation and the staff from the Theptarin hospital for their help. We also thank Halal Science Center for their facilities and instruments. The authors have no conflicts of interest to declare. REFERENCES [1] Rambhade S; Chakraborty AK; Patil UK; Rambhade A. J. Chem. Pharm. Res., 2010, 2(6), 7- 25. [2] Wild S; Roglic G; Green A; Sicree R; King H. Diabetes Care., 2004, 27, 1047–1053. [3] Ginsberg HN; Zhang YL; Hernandez-Ono A. Arch Med Res., 2005, 36, 232-240. [4] Kreisberg RA. Am J Cardiol., 1998, 82(12A), 67U-73U. [5] Bansal S; Buring JE; Rifai N; Mora S; Sacks FM; Ridker PM. JAMA, 2007, 298(3), 309-316. [6] Nordestgaard BG; Benn M; Schnohr P; Tybjaerg-Hansen A. JAMA, 2007, 298(3), 299-308 [7] Hogue JC; Lamarche B; Tremblay AJ; Bergeron J; Gagne´ C; Couture P. J Lipid Res, 2007, 48, 1336–1342. [8] Cohn JS; Patterson BW; Uffelman KD; Davingnon J; Steiner G. J Clin Endocrinol Metab, 2004, 89, 3949-3955. [9] Hiukka A; Fruchart NJ; Leinonen E; Hilden H; Fruchart JC; Taskinen MR. Diabetologia, 2005, 48, 1207-1215. [10] Pruneta-Deloche V; Ponsin G; Groisne L; Fruchart-Najib J; Lagarde M; Moulin P. Atherosclerosis, 2005, 181, 403–405. [11] Reddy SR; Chandiran IS; Jayaveera KN; and Divi KR.J. Chem. Pharm. Res., 2010, 2(3), 59-69. [12] Ganesan M; Nanjundan S; Gomathi M; and MuralidharanS. J. Chem. Pharm. Res., 2010, 2(4), 740-746. [13] Chandiran IS; Jayaveera KN; and Reddy SR.J. Chem. Pharm. Res., 2011, 3(2), 341-353. [14] Mancone C; Amicone L; Fimia GM; Bravo E; Piacentini M; Tripodi M; Alonzi T. Proteomics, 2007, 7, 143-154. [15] Karlsson H; Leanderson P; Tagesson C; Lindahl M. Proteomics,2005, 5, 551-565. [16] Rezaee F; Casetta B; Levels JHM; Speijer D; Meijers JCM. Proteomics,2006, 2, 721-730. [17] Sun HY; Chen SF; Lai MD; Chang TT; Chen TL; Li PY; Shieh DR; Young KC. Clin Chim Acta,2010, 411, 336-44. [18] Karlsson H; MÖrtstedt H; Lindqvist H; Tagesson C; Lindahl M. Proteomics - Clinical Applications,2009, 3, 663-671. [19] Guerci B; Paul JL; Hadjadj S; Durlach V; Vergès B; Attia N; Girard-Globa A; Drouin P. Diabetes Metab,2001, 27, 449-457. [20] Karamanos BG; Thanopoulou AC; Roussi-Penesi DP. Diabet Med,2001, 18, 32-39. [21] Matthews DR; Hosker JP; Rudenski AS; Naylor BA; Treacher DF; Turner RC. Diabetologia,1985, 28, 412–419. [22] Sittiwicheanwong R; Ariyapitipun T; Gulsatitporn S; Nopponpunth V; Abeywardena M; Dahlan W. Asia Pac J Clin Nutr,2007, 16(4), 602-608. [23] Karpe F; Hamsten A. J Lipid Res,1994, 35, 1311-1317. [24] Bradford MM. Anal. Biochem.,1976, 72, 248-254. [25] Rivellese AA; Natale CD; Marino LD; Patti L; Iovine C; Coppola S; Prato SD; Riccardi G; Annuaau G. J Clin Endocrinol Metab,2004, 89, 2153–2159. [26] Annuzzi G; Natale CD; Iovine C; Patti L; Marino LD; Coppola S; Prato SD; Riccardi G; Rivellese AA. Arterioscler Thromb Vasc Biol, 2004, 24, 2397-2402. [27] Goldberg IJ. J Clin Endocrinol Metab,2001, 86, 965-971. J. Chem. Pharm. Res., 2011, 3(4):257-269 - 268 -
Winai Dahlanet al ______________________________________________________________________________ [28] Ghiselli G; Schaefer EJ; Light JA; Brewer JHB.J Lipid Res,1983, 24, 731-736. [29] Sundsten T; Eberhardson M; Göransson M; Bergsten P. Proteome Science, 2006, 4, 22. [30] Cohn JS; Patterson BW; Uffelman KD; Davingnon J; Steiner G. J Clin Endocrinol Metab, 2004, 89, 3949-3955. [31] Wang CS; McConathy WJ; Kloer HU; Alaupovic P. J Clin Invest,1985, 75, 384–390. [32] Aalto-Setala K; Weinstock PH; Bisgaier CL; Wu L; Smith JD; Breslow JL. J Lipid Res,1996, 37, 1802–1811. [33] Olin-Lewis K; Krauss RM; La Belle M; Blanche PJ; Barrett PH; Wight TN; Chait A. J Lipid Res, 2002, 43, 1969–1977. [34] Zanotti G; Berni R. Vitam Horm,2004, 69, 271-295. [35] Tan KCB; Shiu SWM; Kung AWC. J Clin Endocrinol Metab,1998, 83, 140–143. [36] Graham TE; Yang Q; Bluher M; Hammarstedt A; Ciaraldi TP; Henry RR; Wason CJ; Oberbach A; Jansson PA; Smith U; Kahn BB. N Engl J Med,2006, 354, 2552-2563. [37] Yang Q; Graham TE; Mody N; Preitner F; Peroni1 OD; Zabolotny JM; Kotani K; Quadro L; Kahn BB.Nature,2005, 436, 356-362. [38] Ingelsson E; Sundstrom J; Melhus H; Michaëlssond K; Bernec C; Vasane RS; Risérusb U; Blomhofff R; Lindc L; Ärnlövb J. Atherosclerosis,2009, 206, 239–244. [39] Liz MA; Faro CJ; Saraiva MJ; Sousa MM. J Biol Chem,2004, 279 (20), 21431–21438. [40] Chen Q; Reis SE; Kammerer CM; Mcnamara DM; Holubkov R; Sharaf BL; et al. Atherosclerosis, 2003, 169, 159-167. [41] Verges B. Diabete Metab,1995, 21(2), 99-105. [42] Polz E; and Kostner GM. FEBS Lett., 1979, 102, 183-186. [43] Ruiu G; Gambino R; Veglia F; Pagano G; Cassader M. Clin Genet,1997, 52(3), 167-72. J. Chem. Pharm. Res., 2011, 3(4):257-269 - 269 -