Download
1 / 117
1.18k likes | 1.47k Views
Risk-Based Management of Hurricane Preparedness and Recovery for a Highway Agency. Presented to the Virginia Department of Transportation Steering Committee by the Center for Risk Management of Engineering Systems March 19, 2000. VDOT Steering Committee.

E N D
Risk-Based Management of Hurricane Preparedness and Recovery for a Highway Agency Presented to the Virginia Department of Transportation Steering Committee by the Center for Risk Management of Engineering Systems March 19, 2000
VDOT Steering Committee Virginia Department of Transportation Travis Bridewell Mac Clarke Perry Cogburn Jon DuFresne Stephany Hanshaw Steve Mondul Murali Rao Bob Rasmussen J.R. Robinson Gerald Venable Virginia Transportation Research Council Wayne Ferguson
Newport News Police Virginia Beach Police Norfolk Police Franklin Police Chester Police OBICI Hospital Red Cross Norfolk Emergency Operations Center Virginia Department of Emergency Services Virginia State Police VDOT Traffic Engineering VDOT ITS Sentara Hospitals Virginia Beach Fire Virginia Beach Office of Emergency Management Virginia Port Authority Virginia Department of Rail and Public Transportation Stakeholders
University of Virginia Graduate Student Richard D. Moutoux Undergraduate Students Ryan M. Finseth Linn H. Koo Clare E. Patterson Timothy J. Zitkevitz Faculty James H. Lambert, Research Assistant Professor of Systems Engineering Yacov Y. Haimes, Quarles Professor of Systems and Civil Engineering Garrick E. Louis, Assistant Professor of Systems Engineering Project website: http://www.virginia.edu/~risk/recovery
Progress Reviews • Stakeholders workshop – February 28, 2000 • Hampton Roads Planning District Commission (HRPDC) – April 5, 2000 • Virginia Department of Emergency Management (VDEM) – October 6, 2000 • Steering committee – December 2, 1999 and December 12, 2000
Overview of Presentation • Introduction • Overview of approach • Risk-based prioritization of recovery • Decision support for resource allocation • Agency coordination of recovery schedule • Trade-off analysis of recovery and preparedness alternatives • Equipment enhancement • Use of hurricane forecasts
Motivation • Restore mobility as quickly as possible • Currently no formal highway recovery methodology exists • Justify aid from FEMA and FHWA • Potential for $30-60 billion in losses for a category IV hitting Tidewater, Richmond, or Northern Virginia (Source: Post Hurricane Recovery Workshop, Insurance Institute, 1997)
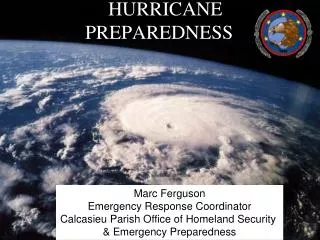
Hurricane Floyd • Hurricane Floyd hit Suffolk District in mid-September, causing significant flood damage • 56 deaths made Floyd the deadliest US hurricane since Agnes in 1972 • Roads did not receive much wind damage, but flooding closed many roads in Virginia
Project Goal The goal of the effort is to improve hurricane preparedness and recovery of the Virginia Department of Transportation through the identification of planning and management options and the assessment and evaluation of the associated costs, benefits, and risks
Task 1: Review of Literature and Formation of Advisory Committees • Review and evaluation of past studies, theory and methodology, other agencies' experience, and databases • Two advisory committees: (1) Steering Committee, consisting primarily of VDOT personnel; and (2) a Users' Group, made up of localities and other government agencies, e.g., emergency services.
Task 2. Extension of Prioritization Tool to GIS Platform • Integrate the mapping of critical facilities with VDOT's capabilities for geographic information system (GIS) • Work closely with the Transportation Information Management Steering Committee (TIMSC) and current managers of VDOT information systems, including GIS, to ensure compatibility.
Task 3. Incorporation of Localities and Additional Critical Facilities • Local jurisdictions • Intermodal connections (ports, airports, rail) • Number of people served • Logistic points (e.g., food warehouses, power generation facilities, water bottling plants, natural gas pipeline heads, collection and distribution points).
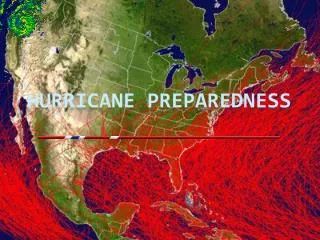
Task 4. Use of Hurricane Forecasts for VDOT Operations • National Hurricane Center and others • The effort will demonstrate the efficacy of probabilistic hurricane forecasts in support of various VDOT planning and management functions. • Capture the impacts of current decisions to future options
Task 5. Modeling for Agency-Wide Preparedness and Recovery • Hierarchical holographic modeling (HHM) will be used to classify overlapping and connected functions, divisions, and performance metrics • Similar studies for the DoD, FBI, and PCCIP • Foundation for resource allocation and coordination within and outside agency
Task 6. Resources, Databases, and SoftwareTask 7. Reports, Presentations, and Workshop
Trade-Off Analysis (cont.) Option3 Option2 Option1 Status Quo
Features of Priority Setting • Importance of roads and intersections based on critical facilities and condition of road network • Restoring or replacing damaged equipment • Critical facilities are those necessary for a community’s well-being
Geographic Information Systems • Build on an existing GIS database of VDOT roads • Network modeling used to create prioritization tool • Using Microsoft Excel for optimization and user functionality
Electronic Road Map • Two sources for electronic road maps • VDOT’s “Network Level Basemap” • Used to establish road system from which network model will be created • Census maps obtained from UVA Library • Used for geocoding addresses
Suffolk District Eastern Shore Williamsburg Hampton Roads Emporia Example of Arcview Map
Facility Data Acquisition • Worked with the Hampton Roads Planning District Commission to get data on locations of critical facilities • Facility data also collected by geocoding addresses in Arcview • Critical facilities stored by category and sub-category
Data Summary • Data gathered includes critical facilities, population, highway mileage, and connections • Data is imported into Excel using a grid system • Data is used to create a prioritization model in Excel
Excel Grid Method • Microsoft Excel is used for the prioritization model • A map is in the background of a spreadsheet for spatial reference • In addition to being much easier for VDOT to use, the spreadsheet format makes modeling straightforward
Prioritization in Excel • Spreadsheet layers contain facilities, road mileage, population, etc. • Priority metrics are calculated across the grid • Priorities are reflected by color-coding grid elements
Decision Criteria • The following types of data can be used for spreadsheet prioritization: • Population • Roadway mileage by road type (Interstate, US highway, or primary route) – three different measurements • Critical facilities by category (eight categories) • All combinations are possible
Operating the Prioritization Tool • All that is required is an entry of one or zero in each box of this table • A one includes that category in the calculation • This example does not break down the road types or the many categories of facilities
Temporal Priorities • The model will prioritize recovery differently based on short, medium, and long-term goals • Certain facilities are most important immediately after a disaster, and others are needed further down the road • Since the Excel model includes data for all categories of facilities, roads, and population, these changes will be simple to implement
Phases of Preparedness …. …. ….
Motivation • Hurricane Floyd struck Virginia in September 1999 and resulted in severe damage from flooding • Over 100,000 phone calls to Emergency Operations Center as a result • Large scale of disaster makes it difficult to appreciate where the resources are going