Download
1 / 47
470 likes | 597 Views
Risk-Based Hurricane Recovery of Highway Signs, Signals and Lights. presented to Virginia Department of Emergency Management by the Center for Risk Management of Engineering Systems October 6, 2000. Project Team. Virginia Department of Transportation Travis Bridewell Lynwood Butner

E N D
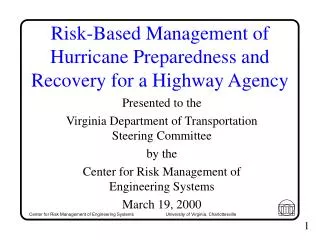
Risk-Based Hurricane Recovery of Highway Signs, Signals and Lights presented to Virginia Department of Emergency Management by the Center for Risk Management of Engineering Systems October 6, 2000
Project Team Virginia Department of Transportation Travis Bridewell Lynwood Butner Mac Clarke Perry Cogburn Jon DuFresne Stephany Hanshaw Steve Mondul Gerald Venable Virginia Transportation Research Council Wayne Ferguson
Project Team (cont.) Students Ryan Finseth Clare Patterson TJ Zitkevitz Linn Koo Richie Moutoux Advisors Professor James H. Lambert Professor Yacov Y. Haimes
Overview of Presentation • Introduction • Overview of Project and Goals • Retrofitting and Upgrading Options • Spares and Reserves Options • Priority Setting • Recommendations
Motivation • Why a Recovery Plan is Needed • Restore mobility and save lives • Solicit aid from FEMA and FHWA • Estimate $30-60 billion if categ.4 hit Hampton Rds, Richmond, and NoVa (Source: 97 Post Hurricane Recovery Workshop, Insurance Institute) • Current Plan • Allows inventory only for routine damage • Absent rationale for recovery priorities
Hurricane Andrew Impacts Dade County, FL • Replaced 2,000 signal heads at 400 intersections • Replaced signs • 7 Overhead structure signs • 45 Multipost ground mounted signs • 169 Single post ground mounted signs • 5 Span-wire attached signs • Compared with ‘Groundhog Storms’ (1998) • 40 Signal heads • No damage to signs reported • Storage of these items is associated with scheduled maintenance or upgrades to the system Source: Fr. Adofo Fassrainer, FDOT-D6 OPERATIONS
Hurricane Floyd • Hurricane Floyd hit Suffolk District in mid-September, causing significant flood damage • 56 deaths made Floyd the deadliest US hurricane since Agnes in 1972 • Roads did not receive much wind damage, but flooding closed many roads in Virginia
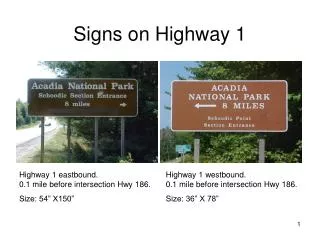
Suffolk District • Interstates 64, 264, 464, 564, and 664 • US Routes 13, 17, 58, 60, 258, 460 • State Routes 44, 164, and 168
Project Objective The goal of the effort is to aid the Virginia Department of Transportation (VDOT) in planning and management for the hurricane recovery of highway signs, lights, and signals through assessment of the risks, costs, and benefits of alternatives.
Wind Speed Assumptions • Not all equipment experience maximum sustained wind speed • Most equipment experience less than maximum sustained wind speed • Few equipment experience wind speeds greater than max sustained wind speed
Upgrading Costs* *communicated with Vince Roney, Suffolk District
Spares and Reserves • Motivation • Currently VDOT and others prepare for low level damage • New spares and reserves leads to faster, cheaper post-hurricane recovery • Objective • Assess the costs and benefits of inventory options
Spares Options • Options in terms of % of damageable equipment currently installed on roadways
Spares Cost Analysis • Pre Hurricane Costs • Cost to increase current level • Annualized cost under low demand • Yearly storage cost • Post Hurricane Costs • Affected by hurricane severity • Costs under moderate and high demand
I (low damage, mod demand) $ Option 1 II (moderate damage, mod demand) $ Option 2 III (extensive damage, mod demand) $ IV (extreme damage, high demand) $ Option 3 V (catastrophic damage, high demand) $ Post Hurricane Costs
Spares Cost Assumptions • Signs will be produced in-house unless under extreme demand (Paul Balderson) • Sign shops provide signs at cost • All other equipment will be purchased from contractors • Shops not equipped to produce cantilevers, signals, and lights • Cost of purchasing equipment increases by 2-3 times under heightened demand
Option 3 Option 2 Option 1 Status Quo Investment in Spares vs. Post Hurricane Cost (Ground Signs)
Time to Recovery under Spares Options • Reduction of Time to Recovery • Spares and reserves • Reduction in manufacture and delivery time • Immediate replacement of equipment • Data used in calculation • Manufacture and delivery time • Installation time
Investment in Spares vs. Time to Recovery (Ground Signs) Option3 Option2 Option1 Status Quo
Features of Priority Setting • Importance of roads and intersections based on critical facilities and condition of road network • Restoring or replacing damaged equipment • Critical facilities are those necessary for a community’s well-being
Geographic Information Systems • Build on an existing GIS database of VDOT roads • Network model in Arcview to create prioritization tool • Using Arcview’s Network Analyst for optimization
Electronic Road Map • Two sources for electronic road maps • VDOT’s “Network Level Basemap” • Used to establish road system from which network model will be created • Census maps obtained from UVA Library • Used for geocoding addresses
Suffolk District Eastern Shore Williamsburg Hampton Roads Emporia Example of Arcview Map
Facility Data • Working with the Hampton Roads Planning District Commission to get data on locations of critical facilities • HRPDC’s databases are much more complete and accurate than any data collection we can do • Data acquisition and formatting is ongoing
Phases of Preparedness …. …. ….
From Map to Network Model • The Arcview maps need translation to a mathematical model • Data consists of intersections, road segments, and various classes of critical facilities • Mathematical model is in terms of nodes, arcs, and levels of supply and demand
Recommendations Consider three remedies: 1) Upgrading equipment 2) Increasing spares and reserves 3) Priority setting of roads for recovery
Sample of Recommendations • Upgrading overhead (two pole span) signs on critical routes (10% of installed base = 35 signs ) • Assume pay 3.3% of total cost annually • Replacement cost per sign = $75,000 * Over 30 years
Sample of Recommendations (cont.) • Spares for ground signs in Suffolk District • Assume pay 5% of total cost annually (12,000 installed) * Over 20 years
Recommendations (cont.) • Notice the problem: Hurricanes can cause region-wide damage to traffic equipment • Consider short (days or weeks), medium (months), and long-term (years) aspects of recovery • Short-- Hospitals, Medium-- Schools, Long-- All • Evaluate different upgrading or spares policies by assessing the cost before a hurricane strikes and the damage, cost, and recovery time after a hurricane
Recommendations (cont.) • Adapt spares and reserves to hurricane-center and other seasonal forecasts • Perform impact analysis using the various storm categories • Adopt the models for estimating the costs and effectiveness of upgrading and spares policies • Consider upgrading only routes critical to a community’s well-being in a hurricane
Recommendations (cont.) • Consider critical facilities throughout the road network in setting priorities for recovery • Consider the following facilities as critical: emergency, education, government, military, operations, commerce, communications, and transportation. • Maintain a web site for support of recovery of signs, signals, and lights.