Download
1 / 66
660 likes | 1.1k Views
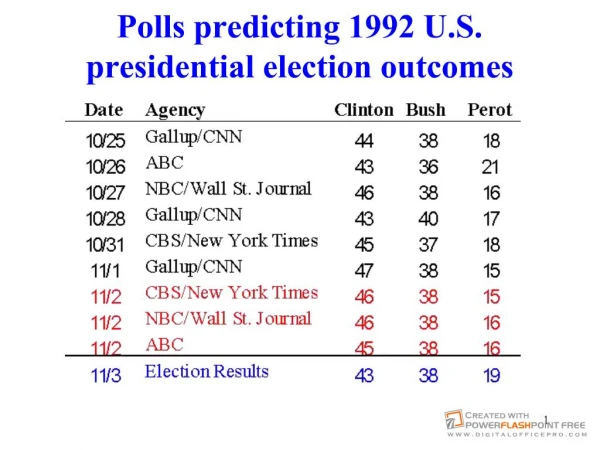
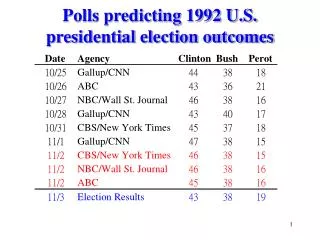
Polls predicting 1992 U.S. presidential election outcomes Polls predicting 1996 U.S. presidential election outcomes How many interviews it took to estimate the behaviors of 90 million voters? Less than 2,000 The History of Sampling

E N D
How many interviews it took to estimate the behaviors of 90 million voters? • Less than 2,000
The History of Sampling • In 1920, Literary Digest mailed postcards to people in 6 states, asking whom they were planning to vote for in the presidential campaign. • The Digest correctly predicted that Harding would be elected. • In the elections that followed, the Literary Digest expanded the size of its poll and made correct predictions in 1924, 1928, 1932.
The History of Sampling • In 1936, Literary Digest conducted its most ambitious poll: 10 million ballots were sent to people listed in the telephone directories and on lists of automobile owners. • Over 2 million responded, given the Republican contender Alf London, a 57 to 43 percent landslide over the incumbent, president Roosevelt. • Election results: Roosevelt won 61% of the votes.
The History of Sampling • Problem: 22% return rate. • A part of the answer to these questions lay in the sampling frame used by the Digest: telephone subscribers and automobile owners. • Such a design selected a disproportionately wealthy sample. • The sample effectively excluded poor people, and the poor people predominantly voted for Roosevelt’s New Deal recovery program during the depression period.
The History of Sampling • In the same year (1936), George Gallup correctly predicted that Roosevelt would beat London. • Gallup’s success in 1936 hinged on his use of quota sampling, which is based on a knowledge of the characteristics of the population being sampled. People are selected to match the population characteristics. • Using quota sampling, Gallup successfully predicting the presidential winner in 1940 and 1944.
The History of Sampling • In 1948, Gallup mistakenly picked Thomas Dewey over incumbent president Harry Truman. • Factors accounted for 1948’s failure: • 1). Most of the pollsters stopped polling in early Oct despite a steady trend toward Truman during the campaign. • 2). “Undecided” voters went disproportionately for Truman. • 3).Unrepresentativeness of the sample (resulting from quota sampling).
The History of Sampling • Quota sampling technique requires that the researcher know something about the total population. • For national political polls, such information came primarily from census data. • By 1948, however, WWII had produced a massive movement from country to city, radically changing the character of the U.S. population, and Gallup relied on 1940 census data (City dwellers tended to vote Democratic; hence the over-representation of rural voters also underestimated the number of Democratic votes).
Why sample? • A sample may be more accurate than a census抽樣的品質會高於普查,原因: • Accuracy and precision觀察量少﹐可作深入細密的觀察 • Census of a large population increase the likelihood of nonsampling errors because of the increased volume of work. 資料處理過程錯誤降低﹐90%的誤差為非抽樣的誤差 • EX>Bureau of the Census uses samples to check the accuracy of the U.S. Census. • Speed of response可以較快的速度得到結果 • Cost • Destructive sampling: 燈泡的壽命
Sampling Design Sample designs • Nonprobability samples • Convenience • Judgment • Quota • Snowball • Probability samples • Simple random • Systematic • Stratified • Proportionate • Disproportionate • Cluster • Multistage There are no appropriate statistical techniques for measuring random sampling error from a non-probability sample. Thus projecting the data beyond the sample is statistical inappropriate.
Nonprobability Sampling • Social research is often conducted in situations where you can't select the kinds of probability samples used in large-scale social surveys. • Lack of population list: Suppose you wanted to study homelessness: There is no list of all homeless individuals, nor are you likely to create such a list.
Convenience Sampling • 便利抽樣 (haphazard or accidental sampling), relying on available subjects • EX> man-on-the-street interviews, radio station call in to reflect public opinions. Talk to friend about their political sentiment • EX> professor uses students as sample • EX> every tenth student entering the university library. • EX> Survey “over sea Chinese for international marketing?”
Convenience Sampling • Advantages: Very low cost, extensively used, No need for list of population. • It is justified only if the researcher wants to study the characteristics of people passing the sampling point at specified times or if less risky sampling methods are not feasible.
Convenience Sampling • Problems: • (1) no way of knowing if those included are representative. • (2) Variability and bias of estimates cannot be measured or controlled. • (3) Projecting the results beyond the specific sample is inappropriate. • Should be use only for exploratory design to generate ideas and insights. • you should alert readers to the risks associated with this method.
Judgment Samples (Purposive Samples)判斷抽樣 • hand-picked sample elements, believed to be representative of the population of interest • EX> a fashion manufacturer regularly selects a sample of key accounts that it believes are capable of providing the information to predict what will sell in the fall. • EX> Dow Jones industrial average: select 30 blue-chip stocks out of 1,800 stocks. Highly correlated with other NYSE indicators on the daily percentages of price changes • EX>Representative communities in U.S. presidential election. • EX> CPI—產品項目的選擇。
Snowball sample雪球抽樣 • Locate an initial set of respondents. These individual are then used as informants to identify others with the desired characteristics. • Appropriate when the members of a special population are difficult to locate. 為估計很難尋找或十分稀少的特性。
Snowball sample雪球抽樣 • EX> survey users of an unusual product: a study among deaf for product that would allow deaf people to communicate over telephone. • EX> 特殊生活習慣(同志調查),homeless, gangsters, migrant workers, undocumented immigrants. • EX> network study,特殊疾病(HIV) • Bias: a person who is known to someone has a higher probability of being similar to the first person.
Quota samples配額抽樣 • by selecting sample elements in such a way that the proportion of the sample elements possessing a certain characteristics is approximately the same as the proportion with the characteristics in the population. • Establishing a characteristics matrix: What proportion of the target population is male and female? what proportions of each gender fall various age categories, educational level, ethnic groups,…etc. • Once such a matrix has been created and a relative proportion assigned to each cell in the matrix, you collect data from people having all the characteristics of a given cell. • All the persons in a given cell are then assigned a weight appropriate to their portion of the total population.
Quota samples配額抽樣 • Problems: • The sample could be far off with respect to other important characteristics. • The quota frame must be accurate, and it is often difficult to get up-to-date information for this purpose.
Quota samples配額抽樣 • Biases may exist in the selection of sample elements within a given cell. The interviewer has a quota to achieve. The actual choice of elements left to the discretion of the individual field worker. Interviewers are prone to follow certain practices
Quota samples配額抽樣 • those who are similar to the interviewers are more likely to be interviewed, • toward the accessible (first floor, airline terminals, business district, college campus), • toward household with children, exclude working people, • against workers in manufacturing (service and administrative), • against extreme of income (EX> "mansions" were skipped because the interviewer did not feel comfortable knocking on doors that were answered by servants. ), • against the less educated, against low-status individuals
The logic of probability sampling • EPSEM (equal probability of selection method): a sample will be representative of the population from which it is selected if all members of the population have an equal chance of being selected in the sample. • We must realize that even carefully selected EPSEM samples seldom (if ever) perfectly represent the populations from which they are drawn.
Probability sampling offers two advantages: • First, probability samples, although never perfectly representative, are typically more representative than other types of samples because the biases previously discussed are avoided. • Second, and more important, probability theory permits us to estimate the accuracy or representativeness of the sample.
Population and Sample element • Element: An element is that unit about which information is collected and that provides the basis of analysis. • People, families, corporations • usually the same as unit of analysis • Population: A population is the theoretically specified aggregation of study elements.
Defining the target population • It is vitally important to carefully define the target population so the proper source from which the data are to be collected can be identified. • Question: "To whom do we want to talk?" What or who will be observed?---answer the questions about the tangible characteristics of the population (1) definition of the element (2) time referent for the study. • EX> “有生育能力的婦女” Or “female between age 12-50”?. • EX>台灣地區成年人口 • EX> 大學生:二專、三專﹖夜間部﹖空中大學﹖研究生 • EX> Industrial buyer behavior • incorrectly define population as the purchasing agents but in fact, industrial engineers within the customer companies had substantial impact on buying decision.
Defining the study population • Study Population: A study population is that aggregation of elements from which the sample is actually selected. • Lists of elements are usually somewhat incomplete • 全國性的調查常忽略「金門」「馬祖」 • 「社會學教授」= 在社會系教書的教授
Sampling units • A sampling unit is that element or set of elements considered for selection in some stage of sampling. • In a simple single-stage sample, the sampling units are the same as the elements and are probably the units of analysis. • EX> passengers on a passengers list sampling unit = elements • In a multi-stage sample: • EX> the airlines could first select flights as the sampling unit, then select certain passengers on the previously select flights. • PSU (primary sampling units) = flights • Secondary sampling units = passengers
Sampling frame • A sampling frame is the actual list of sampling units from which the sample, or some stage of the sample, is selected. Also referred to as the working population. • In single-stage sampling designs, the sampling frame is simply a list of the study population. • Almost all sampling frame exclude some members of the population. A sampling frame error occurs when certain sample elements are excluded or when the entire population is not accurately represented in the sample frame. • We often begin with a population in mind for our study; then we search for possible sampling frames, the frames available for our use are examined and evaluated.
Observation unit • An observation unit, or unit of data collection, is an element or aggregation of elements from which information is collected. • EX) Researcher may interview heads of households (the observation units) to collect information about all members of the households (the units of analysis).
Types of Sampling Designs • Simple Random Sampling • Systematic Sampling • Stratified Sampling • Cluster Sampling
Simple Random Sampling簡單隨機抽樣 • Simple random sampling is the basic sampling method assumed in the statistical computations of social research. • Establish a sampling frame • Assigns a single number to each element in the list, not skipping any number in the process. • generates series of random numbers to select the elements • Simple random sampling is seldom used in practice
Systematic Sampling系統抽樣 • A systematic sample with a random start--a procedure in which an initial starting point is selected by a random process, and then every kth number on the list is selected. • Sampling interval: the number of population elements between the units selected for the sample. • Sampling interval = population size / sample size • Sampling ratio = sample size / population size • Systematic sampling is virtually identical to simple random sample. If the list of elements is indeed randomized before sampling, one might argue that a systematic sample drawn from that list is in fact a simple random sample. • Systematic sampling is much easier to conduct.
Problem of periodicity • The arrangement of elements in the list can make systematic sampling unwise. • EX> collecting retail sales information every seventh day (Monday) • EX> when the list is not randomly distribute: a list of contributors (donors) ranked by amount of donations. • EX> apartment number
Stratified Random Sampling分層隨機 • Recall that sampling error can be reduced by • (1) increase sampling size • (2) a homogeneous population produces samples with smaller sampling errors than does a heterogeneous population. • The logic of stratified sampling: rather than selecting your sample from the total population at large, you ensure that appropriate numbers of elements are drawn from homogeneous subsets of that population.
Stratified Random Sampling分層隨機 • The parent population is divided into mutually exclusive and exhaustive subsets. • A simple random sample of elements is chosen independently from each group or subset. • To organize the population into homogeneous subsets and to select the appropriate number of elements from each.先將母體劃分成數層(strata),在每一層分別運用隨機抽樣方法抽取部份子樣本。
Stratified Random Sampling分層隨機 • EX> urban and rural groups differ widely on attitudes toward energy conservation, members within each group hold very similar attitudes. • EX> divide the university by college class (freshmen, sophomores, juniors, seniors) • In selecting stratification variables, you should be concerned primarily with those that are presumably related to variables that you want to represent accurately. Such as sex, education, geographic location,…etc. • EX> estimate income stratified by educational level.
Stratified Random Sampling分層隨機 • 層間元素差異性大而層內元素差異性小時(homogeneous within strata),分層抽樣所得結果較佳(sampling error is smaller)。 • The investigator should divide the population into strata so that the elements within any given stratum are as similar in value as possible and the values between any two strata are as disparate as possible. • In the limit, if the investigator is successful in partitioning the population so that the elements in each stratum are exactly equal, there will be no error associated with the estimate of the population parameters.
Increased precision of stratified samples • EX> N=1,000 • Mean = 5 (.2) + 10 (.3) + 20 (.5)= 14, variance = 39 • Suppose that a researcher was able to partitioning the total population so that all the elements with a value of 5 in one stratum, those with value of 10 were in the second, and those with the value of 20 were in the third. • Take a proportionate stratified sample of n=10. • Or select a sample of n=3, and calculate the weighted average.
Proportional stratified sample • Proportional stratified sample: the number of sampling units drawn from each stratum is in proportion to the relative population size of that stratum. • (1) Sort the population into discrete groups (2) On the basis of relative proportion of the population represented by a given group, select several elements from tat group constituting the same proportion of y our desired sample size. • (1) Group elements and then put groups together in a continuous list (an ordered list, if no periodicity, is sometime better than randomized list--implicit stratification in systematic sampling). (2) Select a systematic from the entire list.
Disproportionate stratified sampling • Balancing the two criteria of strata size and strata variability. Strata exhibiting more variability are sampled more than proportionately to their relative size; those strata that are very homogeneous are sampled less than proportionately.
Multistage cluster sampling群集抽樣 • Used when it is either impossible or impractical to compile an exhaustive list of the elements composing the target population. • 先將母體分群(cluster),將群(cluster)視為母體的抽樣單位進行抽樣。 • EX) 以都市化的程度將台灣分層,每一個都市層內以村里為群進行第一階段隨機抽樣,抽取樣本村里。於樣本村里中進行第二階段的隨機抽樣,抽取樣本戶。 • EX) census blocks---sampled blocked sample household sample individual • EX> sampling high school students in Taiwan requires the entire student list. Cluster sampling: no initial listing is required.
Multistage cluster sampling群集抽樣 • 分層抽樣: • 層數少,層內單位較多。 • 所有層中至少有一單位被選入樣本。 • 只有在每層中選部份單位做為樣本。 • 群集抽樣: • 群數多,群內單位較少。 • 只有部份群集被選為樣本。 • 群集抽樣則在被抽選之群集中進行普查或進行再次抽查。
Multistage cluster sampling群集抽樣 • Price of the efficiency less accurate sample: A simple random sample drawn from a population list is subject to a single sampling error, but a two-stage cluster sample is subject to two sampling errors. (ex> selecting a sample of disproportionately wealthy city blocks, plus a sample of disproportionately wealthy households within those blocks.) • Tradeoff: With a given total sample size, if the number of clusters is increased, the number of elements within a cluster must be decreased. The representativeness of the clusters is increased at the expense of more poorly representing the elements composing each cluster.
Sampling Bias • A sample is biased if it is obtained by a method that favors the selection of elementary units having particular characteristics.