Download
1 / 14
150 likes | 414 Views
The U.S. Presidential Election of 2012. U.S. Presidential Election 2012. Popular Vote Electoral Vote Barack Obama 62,611,250 (50.6%) 332 (61.7%) Mitt Romney 59,134,475 (47.8%) 206 (38.3%) Others 1,968,682 ( 1.6%) 0 Margin of Victory +3,476,775 (+2.8%)

E N D
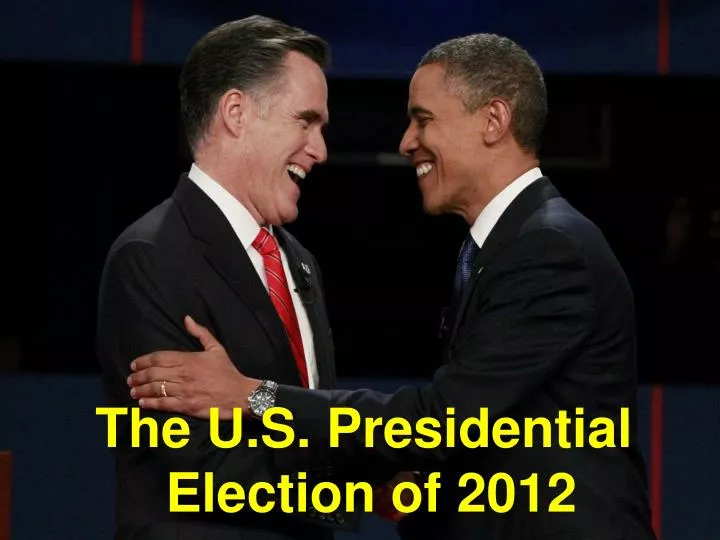
The U.S. Presidential Election of 2012
U.S. Presidential Election2012 Popular VoteElectoral Vote Barack Obama 62,611,250 (50.6%) 332 (61.7%) Mitt Romney 59,134,475 (47.8%) 206 (38.3%) Others 1,968,682 ( 1.6%) 0 Margin of Victory +3,476,775 (+2.8%) N.B. These figures are based on the incomplete nationwide popular vote total as of 28/11/2012 and are not the final vote totals
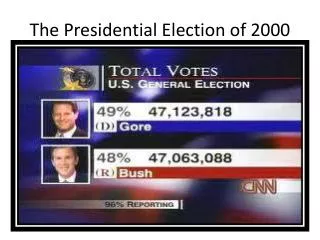
Last 14 Presidential Elections by Closenessof Popular Vote Year Winner Two-Party Popular Vote Margin 2000 G.W. Bush - 0.5% 1960 Kennedy +0.3% 1968 Nixon +0.5% 1976 Carter +2.1% 2004 G.W. Bush +2.4% 2012 Obama +2.8% 1992 Clinton +5.5% 2008 Obama +7.2% 1988 G.H.W. Bush +7.7% 1996 Clinton +8.5% 1980 Reagan +9.7% 1984 Reagan +18.2% 1964 Johnson +22.6% 1972 Nixon +23.2%
U.S. Presidential Election2012 – Voting Turnout Total Votes Cast 2008 131,296,985 2012 123,714,407 Difference -7, 582,578 N.B. These figures are based on the incomplete nationwide popular vote total as of 28/11/2012 And are not the final vote totals.
U.S. Presidential Election2012 – Exit Polls Vote by Gender Male Romney 52% (47% of voters) Female Obama 55% (53% of voters) Data from New York Times Exit Poll at http://elections.nytimes.com/2012/results/president/exit-polls
U.S. Presidential Election2012 – Exit Polls Vote by Race White Romney 59% (72% of voters) Black Obama 93% (13% of voters) Hispanic Obama 71% (10% of voters) Asian Obama 73% ( 3% of voters) Data from New York Times Exit Poll at http://elections.nytimes.com/2012/results/president/exit-polls
U.S. Presidential Election2012 – Exit Polls Vote by Age 18-29 Obama 60% (66% in 2008) 30-44 Obama 52% 45-64 Romney 51% 65 and over Romney 56% Data from New York Times Exit Poll at http://elections.nytimes.com/2012/results/president/exit-polls
U.S. Presidential Election2012 – Exit Polls Vote by Income Under $30000 Obama 63% (20% of voters) $30k-$44k Obama 57% (21% of voters) $50k-$99k Romney 53% (31% of voters) $100k+ Romney 54% (28% of voters) Data from New York Times Exit Poll at http://elections.nytimes.com/2012/results/president/exit-polls
U.S. Presidential Election2012 – Exit Polls Vote by Party Identification Democrats Obama 92% (38% of voters) Republicans Romney 93% (32% of voters) Independents Romney 51% Obama 45% (29% of voters) Others 4% Data from New York Times Exit Poll at http://elections.nytimes.com/2012/results/president/exit-polls
U.S. Presidential Election2012 – Exit Polls Vote by Religion Obama Romney Protestant 42% 57% Catholic 50% 48% Jewish 69% (84% in 2008) 30% (26% in 2008) Data from Washington Post Exit Poll at http://www.washingtonpost.com/wp-srv/special/politics/2012-exit-polls/table.html
Congressional Races House of Representatives Republicans 234 (net loss of 6 seats) Democrats 200 (net gain of 12 seats) To be decided 7 Senate Democrats 53 (net gain of 2 seats) Republicans 45 (net loss of 2 seats) Independents 2 N.B. These figures are based on the seat decided as of 28/11/2012.
Republicans in 2016? Jeb Bush Marco Rubio Marco Rubio Chris Christie Paul Ryan
Republicans in 2016? Jeb Bush Marco Rubio Marco Rubio Chris Christie Paul Ryan
Democrats in 2016? Joe Biden Hillary Clinton Andrew Cuomo