Download
1 / 27
330 likes | 575 Views
Hotspot Mapping, Near Repeat Analysis, and Risk Terrain Modeling. Joint Operational Utility. Leslie W. Kennedy Joel M. Caplan Eric L. Piza Rutgers, The State University of New Jersey School of Criminal Justice Center for Law & Justice 123 Washington Street Newark, NJ 07102

E N D
Hotspot Mapping, Near Repeat Analysis, and Risk Terrain Modeling Joint Operational Utility Leslie W. Kennedy Joel M. Caplan Eric L. Piza Rutgers, The State University of New Jersey School of Criminal Justice Center for Law & Justice 123 Washington Street Newark, NJ 07102 www.rutgerscps.org www.riskterrainmodeling.com Presentation to UCL Department of Security And Crime Science October 4, 2011
Data • Violent crimes (aggravated assaults, homicides, robbery, shootings, and weapon possession) • Provided by the NJ State Police through the Regional Operations Intelligence Center. • 52 violent crime incidents from April to August 2007 • 57 violent crime incidents from April to August 2008.
Hotspot Mapping • Hotspots: areas with high concentrations of crime. • Conventional hotspot mapping: uses locations of past events to anticipate locations of future similar events.
Hotspot Mapping • Over +2 Standard Deviations is statistically the top 5%
Hotspot Mapping (Pearson Chi-Squared value=13.50; df=1; p<0.01)
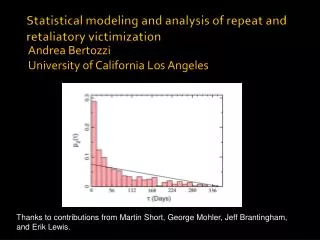
Near Repeat Analysis • If a crime occurs at a location, the chances of a future crime occurring nearby increases • Many near repeat incidents over time could result in hotspots
Near Repeat Analysis • April-Aug 2007 Violent Crimes: • 500% greater chance of victimization at the same place up to 7 days after an initial incident • 153% greater chance of near repeat occurring within 14 days at 801-900 feet from initial incident 1 block ~ 370ft NR Calculator: http://www.temple.edu/cj/misc/nr
Near Repeat Analysis • Use knowledge of near repeat phenomenon to intervene at certain places • Like hotspot mapping, it relies on the occurrence of crime before predicting future behavior
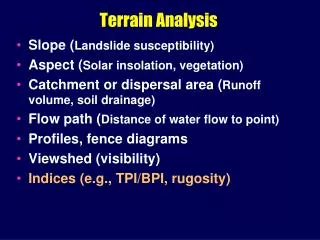
Risk Terrain Modeling • Risk Factors • Gang members • Bus stops • Schools • Public housing • Bars, clubs, fast food restaurants, and liquor stores
Risk Terrain Modeling • 38% of all violent crimes in 2008 happened at places with risk values of 3 or more • 10% of the area of Irvington • Hotspot locations did not move from year to year because environments stayed criminogenic
Joint Operational Utility • Capitalize on unique strengths of each method
Joint Operational Utility • Violent crimes occur at places with higher environmental risks • Especially if violent crimes already occurred there
Joint Operational Utility Summary: • Violent crimes occur at places with high environmental risks • If environmental risks aren’t mitigated, then crimes will continue at same places, creating hotspots • Unpreventable instigator crimes will attract near repeats at places of higher environmental risk
Joint Operational Utility Use the “Near Repeat Opportunities” tool in the RTM Toolset
Tactical Deployment Decisions: From Product A Respond immediately to crime hotspots and high-risk places From Product B Limit length of time for targeted deployments From Product C Prioritize target areas
Hotspot Mapping, Near Repeat Analysis, and Risk Terrain Modeling Joint Operational Utility Leslie W. Kennedy Joel M. Caplan Eric L. Piza Rutgers, The State University of New Jersey School of Criminal Justice Center for Law & Justice 123 Washington Street Newark, NJ 07102 www.rutgerscps.org www.riskterrainmodeling.com