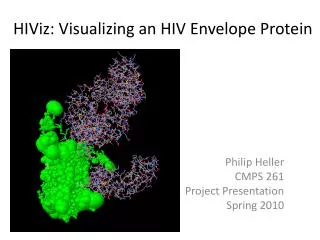
MolNav: A tool for visualizing protein disorder
90 likes | 344 Views
MolNav: A tool for visualizing protein disorder. Chris Crosetto 1 , Keith Dunker 1 , Tanguy Le Gall 1 , Randy Heiland 2 , Charles Moad 2 1 -Molecular Kinetics, Inc., 2 -IU Pervasive Technology Labs Contact: kedunker@iupui.edu, heiland@iupui.edu

MolNav: A tool for visualizing protein disorder
E N D
Presentation Transcript
MolNav: A tool for visualizing protein disorder Chris Crosetto1, Keith Dunker1, Tanguy Le Gall1, Randy Heiland2, Charles Moad2 1-Molecular Kinetics, Inc., 2-IU Pervasive Technology Labs Contact: kedunker@iupui.edu, heiland@iupui.edu 1st Annual Indiana Bioinformatics Conference May 27, 2004 ®
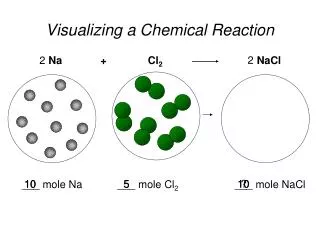
What is protein disorder? Disordered regions (DRs) are entire proteins or regions of proteins which lack a fixed tertiary structure, essentially being partially or fully unfolded. Such disordered regions have been shown to be involved in a variety of functions, including DNA recognition, modulation of specificity/affinity of protein binding, molecular threading, activation by cleavage, and control of protein lifetimes. Although these DRs lack a defined 3-D structure in their native states, they frequently undergo disorder-to-order transitions upon binding to their partners. Depiction of degrees of protein disorder: 0 – totally ordered 1-5 – partial disorder 6,7 – total disorder
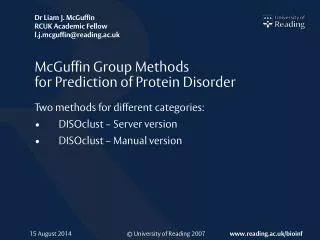
As it is known that sequence determines structure, we assume that sequence would determine lack of structure as well. To test this, we have developed a neural network predictor (NNP) that uses amino acid sequence data to predict disorder in a given region. This Predictor of Natural Disordered Regions is termed PONDR®. PONDR®
PONDR® for p53 PONDR® VLXT Analysis of p53 The p53 protein is one of most extensively studied proteins and about half of human cancers have associated mutations in this protein [3][4]. Application of PONDR® VLXT shows a central, mostly ordered region that corresponds to the DNA binding domain of this protein, with mostly disordered tails outside of the DNA binding region. These disordered regions have been confirmed to be mostly correct by experiments such as NMR spectroscopy. Interestingly, strong downward spikes in the PONDR® VLXT plot correspond to regions of protein-protein interactions. We have observed this phenomenon for several proteins [5]. Preliminary results indicate that such downward spikes in the PONDR® VLXT plots are a useful means for identifying regions of protein-protein and protein nucleic acid interactions that occur within regions of intrinsic disorder.
MolNav – Molecular Navigator • MolNav is a standalone, interactive visualization tool for correlating protein disorder in sequence and structure. • Inputs: (1) PONDR® disorder 2-D plot • (2) .mnp file of backbone coords A .mnp file is computed/delivered by the PONDR® web server. This file contains the disordered residue coords of the structure, computed using a novel random walk algorithm.
MolNav – the application • Platform-independent (Linux, Windows, Mac) • Dependencies: OpenGL and GLUT Both viewers provide dynamic interaction and functionality via popup menus
MolNav – cont. Selecting a region in the sequence viewer (green) will highlight the corresponding backbone structure (also in green; depth-cue shaded). Zooming in on the sequence viewer will cause the amino acid labels to be displayed.
References – Additional Reading • [1] Protein disorder and the evolution of molecular recognition: theory, predictions, and observations. Dunker, A. K., E. Garner, S. Guilliot, P. Romero, K. Albrecht, J. Hart, Z. Obradovic, Pacific Symp. Biocomputing, 1998, 3:473-484. • [2] Sequence complexity of disordered protein. Romero, P., Z. Obradovic, X. Li, E. C. Garner, C. J. Brown, A.K. Dunker. Proteins: Struc., Funct., Gen., 2001, 42:38-48. • [3] Cancer. p53, guardian of the genome. Lane, D. P., Nature, 1992,358:15-16. • [4] p53, the cellular gatekeeper for growth and division. Levine, A. J., Cell , 1997, 88:323-331. • [5] Predicting Binding Regions within Disordered Proteins. Garner, E. et al.. Genome Inform. Ser. Workshop Genome Inform., 1999, 10:41-50. • http://www.pondr.com/ • http://www.ist.temple.edu/research/bioinformatics.html • http://pervasive.iu.edu