Download
1 / 18
180 likes | 353 Views
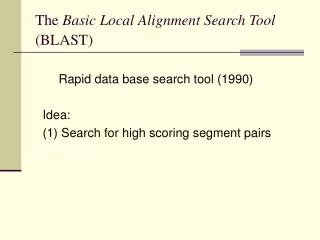
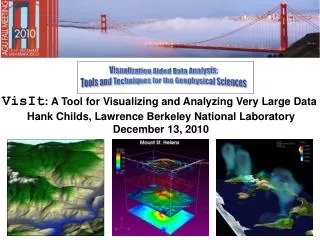
VisIt : A Tool for Visualizing and Analyzing Very Large Data Hank Childs, Lawrence Berkeley National Laboratory December 13, 2010. VisIt is an open source, richly featured, turn-key application for large data. Used by: Visualization experts Simulation code developers

E N D
VisIt: A Tool for Visualizing and Analyzing Very Large Data Hank Childs, Lawrence Berkeley National Laboratory December 13, 2010
VisIt is an open source, richly featured, turn-key application for large data. • Used by: • Visualization experts • Simulation code developers • Simulation code consumers • Popular • R&D 100 award in 2005 • Used on many of the Top500 • >>>100K downloads 1 billion grid points / time slice 217 pin reactor cooling simulation Run on ¼ of Argonne BG/P Image credit: Paul Fischer, ANL
VisIt is used to look at lots of types of simulated and experimental data. Fusion, Sanderson, UUtah Astrophysics, Childs Nuclear Reactors, Childs Particle accelerators, Ruebel, LLNL
AGU examples: environmental management Image credit: Horsman & Bethel, LBL
AGU example: earthquakes Image credits: Boyle, LBL
AGU example: climate Image credit: Prabhat, LBL
Analysis Visual Debugging Data Exploration Presentations Terribly Named!!!… intended for much more than just visualization
Detector provided by VisIt (synthetic diagnostic) Detector at AGEX What sort of analysis is appropriate for VisIt? • General analysis techniques (e.g. integration, volumes, surface areas, etc.) • Specialized analysis (e.g. hohlraum flux at AGEX)
VisIt has a rich feature set. • Meshes: rectilinear, curvilinear, unstructured, point, AMR • Data: scalar, vector, tensor, material, species • Dimension: 1D, 2D, 3D, time varying • Rendering (~15): pseudocolor, volume rendering, hedgehogs, glyphs, mesh lines, etc… • Data manipulation (~40): slicing, contouring, clipping, thresholding, restrict to box, reflect, project, revolve, … • File formats (~110) • Derived quantities: >100 interoperable building blocks • +,-,*,/, gradient, mesh quality, if-then-else, and, or, not • Many general features: position lights, make movie, etc • Queries (~50): ways to pull out quantitative information, debugging, comparative analysis
localhost – Linux, Windows, Mac Graphics Hardware VisIt employs a parallelized client-server architecture. • Client-server observations: • Good for remote visualization • Leverages available resources • Scales well • No need to move data remote machine User data Parallel vis resources • Additional design considerations: • Plugins • Multiple UIs: GUI (Qt), CLI (Python), more… You don’t have to run VisIt this way! You can run all on localhost You can tunnel through ssh and run all on the remote machine
16K 16K, 32K Dawn Cray XT4 1T, 2T #cores Problem Size Model Machine 8K 0.5T IBM P5 Purple 1T 16K Cray XT5 Ranger Franklin 1T X86_64 Juno 32K 2T Sun JaguarPF 64K 4T BG/P VisItrecently demonstrated good performance at unprecedented scale. • Weak scaling study: ~62.5M cells/core Two trillion cell data set, rendered in VisIt by David Pugmire on ORNL Jaguar machine 11
The VisIt team focuses on making a robust, usable product for end users. • Manuals • 300 page user manual • 200 page command line interface manual • “Getting your data into VisIt” manual • Wiki for users (and developers) • Revision control, nightly regression testing, etc • Executables for all major platforms • Day long class, complete with exercises Slides from the VisIt class
More developers Entering repo all the time Partnership with CEA is developed Project started UC Davis & UUtah research done in VisIt repo VACET is funded Developers from LLNL, LBL, & ORNL Start dev in repo AWE enters repo LLNL user community transitioned to VisIt GNEP funds LLNL to support GNEP codes at Argonne 2005 R&D100 SciDAC Outreach Center enables Public SW repo Institutional support leverages effort from many labs Saudi Aramco funds LLNL to support VisIt User community grows, including AWE & ASC Alliance schools 2003 2007 2007 2004-6 ‘07-’08 ‘07-’08 2000 2005 Summer‘07 Spring ‘08 Spring ‘07 VisItis a vibrant project with many participants. • Over 75 person-years of effort • Over 1.5 million lines of code • Partnership between: Department of Energy’s Office of Science, National Nuclear Security Agency, and Office of Nuclear Energy, the National Science Foundation XD centers (Longhorn XD and RDAV), and more…. Fall ‘06 2008
VisIt: What’s the Big Deal? • Everything works at scale • Robust, usable tool • Features that span the “power of visualization”: • Data exploration • Confirmation • Communication • Features for different kinds of users: • Vis experts • Code developers • Code consumers • Healthy future: vibrant developer and user communities
“How to make VisIt work after you get home” • How to get VisIt running on your machine • Downloading and installing VisIt • Building VisIt from scratch • How to get VisIt to read your data • Support for shapefiles, NetCDF, HDF5, and 100+ more • How to get help when you run into trouble • See http://www.visitusers.org/index.php? title=SC10_Tutorial
Satellite image externally obtained and manually registered to simulation space and elevated using height information obtained from yet another external source. Anatomy of a picture Contour of scalar field from simulation Custom reader to read well bore data Lots of “elbow grease” to make this picture. Image credit: Horsman & Bethel, LBL
AGU example: climate Image credit: Prabhat, LBL This is basically the “out of box” picture, modulo changes in color table and annotations.
Summary • VisIt is a richly featured visualization tool that is capable of visualizing data from many different application areas. • Truth in advertising: a general interface & it sometimes takes a lot of effort to get the visualization you want. • VisIt has excellent built in support for large data sets. • User resources: • Main website: http://www.llnl.gov/visit • Wiki: http://www.visitusers.org • Tutorial: http://www.visitusers.org/index.php?title=SC10_Tutorial • Contacts: • Hank Childs, hchilds@lbl.gov • General VisIt user email list: visitusers@ornl.gov