Download
1 / 5
50 likes | 191 Views
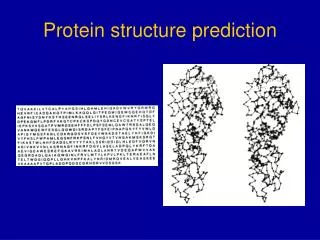
McGuffin Group Methods for Prediction of Protein Disorder. Two methods for different categories: DISOclust – Server version DISOclust – Manual version. S-score (distance between residues). S i = S-score for residue i d i = distance between aligned residues

E N D
McGuffin Group Methods for Prediction of Protein Disorder • Two methods for different categories: • DISOclust – Server version • DISOclust – Manual version
S-score (distance between residues) Si = S-score for residue i di = distance between aligned residues d0 = distance threshold (3.9) Sr = predicted residue accuracy for model N = number of models A = set of alignments Sia = Si score for a residue in a structural alignment (a) Residue accuracy (mean S-score) Disorder score 1-(mean residue accuracy) Pd = posterior probability of disorder M = the set of models Srm = Sr score for a model (m). DISOclust (Server) • Simple clustering method – unsupervised • Compares multiple models from nFOLD3 server • Calculates per-residue accuracy for each model using ModFOLDclust • Outputs probability of disorder (1 minus the mean per-residue accuracy) • Combines score with the scaled DISOPRED score • Manual method – same protocol but using all server models
True positive rate True positive rate False positive rate 0-0.1 False positive rate 0-1
In your analysis of disorder do you treat short disordered regions, e.g. a missing loop in a crystal structure, differently than a disordered domain or an entirely disordered protein? No, all regions are treated the same. No specific methods for long or short regions. Can you briefly describe your disorder analysis, i.e. is it based on physical principals, machine learning or a combination of both. Results from structure based method (DISOclust) are combined with results from a sequenced based machine learning method (DISOPRED). DISOclust significantly improved all CASP7 methods (see paper). Does your analysis of disorder prediction affect your template free modeling, i.e. does the disorder prediction aid your free model prediction? If so, in what way, in practice, did you use your disorder prediction for free modeling? Did not carry out FM, although the method does work for FM targets Can your disorder prediction distinguish between regions predicted to be fully disordered, i.e. 'cooked spaghetti', or alternatively an ensemble of a few alternative conformations? Correctly identified T0484 and T0500 as fully disordered.Works equally well on long/short regions of disorder. The DISOclust server provides visualisation of multiple alternative conformations. Answers to specific questions…
http://www.reading.ac.uk/bioinf/DISOclust/ McGuffin, L. J. (2008) Intrinsic disorder prediction from the analysis of multiple protein fold recognition models. Bioinformatics,24,1798-804. The DISOclust server