Download
1 / 1
20 likes | 566 Views
Predicting lightning density in Mediterranean storms based on the WRF model dynamic and microphysical fields. AE31A-0258. Yoav Yair 1 , Barry Lynn 1 , Colin Price 2 , Vassiliki Kotroni 3 , Konstantinos Lagouvardos 3 Efrat Morin 4 , Alberto Mugnai 5 and Maria-Carmen Llasat 6.

E N D
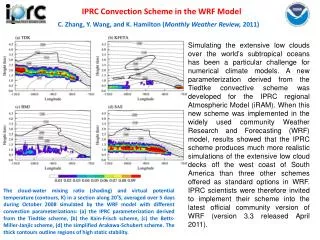
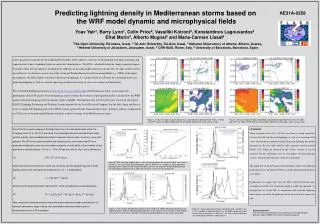
Predicting lightning density in Mediterranean storms based on the WRF model dynamic and microphysical fields AE31A-0258 Yoav Yair1, Barry Lynn1, Colin Price2, Vassiliki Kotroni3, Konstantinos Lagouvardos3 Efrat Morin4, Alberto Mugnai5 and Maria-Carmen Llasat6 1The Open University, Ra'anana, Israel, 2 Tel-Aviv University, Tel-Aviv, Israel, 3 National Observatory of Athens, Athens, Greece, 4 Hebrew University of Jerusalem, Jerusalem, Israel, 5 CNR-ISAS, Rome, Italy, 6 University of Barcelona, Barcelona, Spain A new parameter is introduced: the Lightning Power Index (LPI), which is a measure of the potential for charge generation and separation that leads to lightning flashes in convective thunderstorms. The LPI is calculated within the charge separation region of clouds, where the non-inductive mechanism by collisions of ice and graupel particles in the presence of super-cooled water is most effective. As shown in several case studies using the Weather Research and Forecasting Model (i.e., WRF) with explicit microphysics, the LPI is highly correlated with observed lightning. It is suggested that the LPI may be a useful parameter for predicting lightning as well as a tool for improving weather forecasting of convective storms and flash floods. We used the FLASH project data-base (http://flash-eu.tau.ac.il/index.php) of Mediterranean storms to investigate the performance of the LPI against observed lightning, and to evaluate the evolution of precipitation fields as predicted by the WRF against radar and rain-gauge derived amounts (where available). The lightning data for the Israeli cases was based on the local LPATS (Lightning Positioning and Tracking System) operated by the Israel Electrical Company. For the Italy, Spain and Greece cases we utilized the lightning data of the ZEUS network operated by the National Observatory of Athens, which is comprised of six VLF receivers located around Europe and offers a robust coverage of the Mediterranean region. Figure 1: 3-hour averages of observed lighting, and predicted Lightning Power Index, K-Index, and CPTP values for 0600 to 0900 GMT on 28 October 2006 (Afula, north central Israel). Figure 2: 3-hour averages of observed lighting, and predicted Lightning Power Index, K-Index, and CPTP for 1800 to 2100 GMT on 8 September 2006 (Emilia Romagna, north- western Italy). The LPI is the volume integral of the total mass flux of ice and liquid water within the “charging zone” (0 to -20°C) of the cloud. It is calculated using the simulated grid-scale vertical velocity, and simulated hydrometeor masses of liquid water, cloud ice, snow, and graupel. The LPI is non-zero only within the charging zone, and further the LPI for a particular model grid is only non-zero when a majority of cells within a 5 grid-radius of that grid have a vertical velocity > 0.5 m s-1. The LPI has the units of J kg-1 and is defined as: (1) LPI = ∫∫∫ ε w2dxdydz where the mass mixing ratios for snow (qs), cloud ice (qi) and graupel (qg) are in units [kg/kg], and w is the vertical wind component in m s-1. ε is defined by: (2) ε = 2(QiQl) 0.5 /(Qi+Ql) where Ql is the total liquid water mass and Qi is the ice fractional content defined by (3) Qi = qg [((qsqg)0.5 /(qs+qg) )+ ((qiqg)0.5/ (qi+qg))] Note, most bulk schemes produce mass information and not number concentration of various hydrometeor types. Hence, we used relative masses of water and ice hydrometeors in our LPI formulation. SUMMARY When averaged over a 100 x 100 km2 area, there is a high correlation between the LPI and observed lightning, as well as of maximum LPI values and maximum simulated rainfall. Since the lightning data points presented in the case-study analysis only represent cloud-to-ground flashes (CG) which are detected by the various systems, it can be expected that the correlations may be even higher for total lightning activity, which includes the intra-cloud (IC) component. The superiority of the LPI against thermodynamic indices for lightning prediction such as the KI and CPTP was clearly demonstrated for these case studies. Furthermore, we suggest that since the LPI is derived from the same microphysical fields that eventually produce model precipitation, in principal the use of the LPI, in conjunction with real-time lightning observations, can aid in the prediction of the onset of heavy convective rain. Figure 3: WRF Lightning Power Index vs. time (a) plotted against the number of WRF rain events > 10 mm hr-1 for area around Emilia Romagna, Italy. (b) WRF LPI vs. number of ZEUS observed lightning flashes, obtained after aligning the data such that the peak time of lightning occurrence corresponded to the peak time at which the maximum in the curve of average LPI. Figure 4: The October 28 2006 Afula flood: (a) The number of LPATS-detected cloud to ground lightning flashes and the radar-derived precipitation as a function of time around t he time of peak rainfall. (b) The LPI values and WRF- derived average precipitation for the same time period. Figure 5: Scale separation between convective and stratiform rain: (a) The number of observed flashes vs. the WRF computed rainfall events when the rainfall is >10 mm hr-1. (b) The same variables but for rainfall values between 1and 5 mm hr-1. Acknowledgement This research was conducted in the framework of the FLASH project, contract number 036852 of the EU 6th framework program.