DYnamical and Microphysical Evolution of Convective Storms
140 likes | 276 Views
This study investigates the dynamical and microphysical evolution of convective storms, particularly focusing on rainfall rates observed on August 7, 2010, at 06:10 UTC using data from the Chilbolton radar. Using high-resolution radar images and MetOffice Nimrod data, the research implements a labelling algorithm to track rainfall features based on a minimum threshold. This work addresses storm characteristics including area, azimuth, and core rainfall maxima, contributing to better understanding storm behavior and improving forecasting techniques.

DYnamical and Microphysical Evolution of Convective Storms
E N D
Presentation Transcript
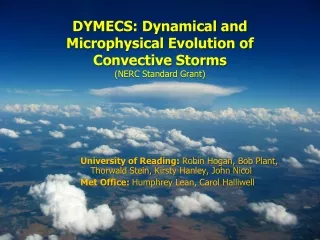
DYMECS DYnamical and MicrophysicalEvolution of Convective Storms Thorwald Stein, Robin Hogan, John Nicol
Rainfall [mm/hr] for 7 August 2010 06:10:00 Centered around the Chilbolton radar location 250 200 • MetOffice Nimrod data • Rainfall radar images 1km res • 5min interval • 1/32=0.03125 mm/hr 150 100 50
0.5 mm/hr 200 • Labelling algorithm • Threshold for minimum rainfall • Threshold for minimum feature size (4km2) 150 100 50
2.0 mm/hr 200 • Labelling algorithm • Threshold for minimum rainfall • Threshold for minimum feature size (4km2) 150 100 50
1.0 mm/hr 200 • Labelling algorithm • Threshold for minimum rainfall • Threshold for minimum feature size (4km2) 150 100 50
1.0 mm/hr 200 • Keep label consistent between images (red) • Register break ups (yellow) • Highlight new storms (green) • Store track (magenta) and lifetime 150 100 50
200 • Per storm, store: • Area • Azimuth • Range • [u,v] • Centroid • Bounding box • Et cetera... • Local rainfall maxima within storm (core, cell) work in progress... 150 100 50
200 Following a long-lived storm 150 100 50
Processing tree (in minutes) 11:30 New scanprocedure submittedto Chilbolton radar 0:00 Met Office Radar network Volume scan 11:00 Tracking done.File with storm propsand labels produced. 10:30 Nimrod datacut to size on400x400km grid 10:00 Nimrod datafrom BADC now at Chilbolton 05:00 Nimrod rainfall data produced
Scan Scheduling Prioritize storms that are already beingtracked
Scan Scheduling Prioritize storms that are already beingtracked