Download
1 / 12
120 likes | 254 Views
Lightning Research at the National Severe Storms Laboratory. Don MacGorman 1,2 , Ted Mansell 1 , Kristin Kuhlman 2 , Alex Fierro 2 , Conrad Ziegler 1 , Stephanie Weiss 2 , Dave Rust 2 1 NOAA/National Severe Storms Laboratory 2 CIMMS/Univ. of Oklahoma & NOAA.

E N D
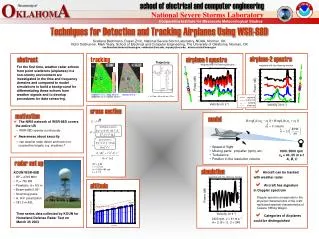
Lightning Research at the National Severe Storms Laboratory Don MacGorman1,2, Ted Mansell1, Kristin Kuhlman2, Alex Fierro2, Conrad Ziegler1, Stephanie Weiss2, Dave Rust2 1NOAA/National Severe Storms Laboratory 2CIMMS/Univ. of Oklahoma & NOAA
NSSL/CIMMS Storm Electrification Research • Storm electrification observations • Studies of OK-LMA data • Balloon-borne electric field & microphysics • Applications for NWS operations • Storm tracking & trends by storm type • Lightning data assimilation • Lightning forecasts • Lightning physics (initiation & attachment) • Lightning climatology
Environmental soundings: 39 on 13 days In-storm soundings: Good soundings on 7 days, 2 with Parsival LMA data processed for central OK cluster, working on incorporating all stations with Texas stations DC3 OK-TX Ballooning & LMA Summary
VHF Source Distribution vs Range 0-25 km 125-150 km 75-100 km 175-200 km
2009 March July May September
MCSs: Evolution of Flash Rates Total Flash Rates CG Flash Rates
Peak in Total Flash Rate Relative to Peak in Brightness Temperature Area -52°C: 11 MCSs -60°C: 12 MCSs -66°C: 11 MCSs
Time-Height Plot of VHF Sources & MaxReflectivity Height Maximum Estimated Hail Diameter
Correlation: Max VHF Source Height vs Max Reflectivity Height